10x8 Moving Average Convergence
Indicator Type: Trend Following
Introduction:
It has often
been said that prices fall faster than they rise, or simply put it is easier to
ride a bike downhill than uphill. Due to this perceived quirk in pricing, the
legendary market analyst, author, and seminar speaker Jake Bernstein developed
the 10 x 8 moving average system.
This system
uses two simple moving averages, but they are calculated in a slightly different
manner than those traditionally used. The first moving average is a moving
average of the daily highs, as opposed to that of the daily settlement like most
traditional moving averages. The second moving average is calculated using the
daily lows.
Though Mr.
Bernstein recommends using a 10 period moving average of the daily highs and a 8
period moving average of the daily, based on his observation that prices tend to
fall about 20% fast than they rise, any combination would do the trick.
Generally though, accepting market lore that prices fall faster than they rise,
the moving average of the lows should be of a shorter term duration than that of
the highs.
Interpretation:
The most basic use of the 10 x 8 Moving Average is to look for a breakout above
the upper moving average to initiate a buy signal. When the daily settlement
price exceeds the average high of the last 10 days, this indicator flashes a buy
signal indicating that the trend of the market should be up.
Program Options - 10x8 MAC
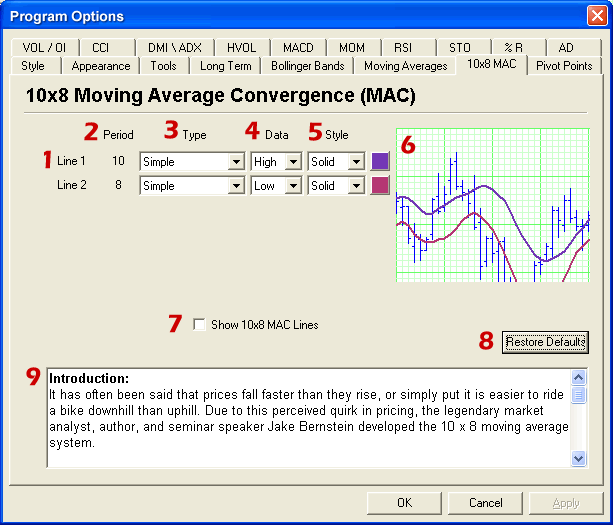
- Lines: The 10x8 MAC consists of two lines. Each lines
parameters may be changed independantly in the options screen. To set the
indicator back to the default settings click on Restore Defaults.
- Period: The period values of the 10x8 MAC are not editable.
If you would like to specify different time periods for an average, it is
recommended that you use a moving average instead of the 10x8 MAC.
- Type: Choose between Simple, Linearly Weighted, and Exponentially
Smoothed averages for each line. Click on the drop down menu and select
the type desired.
- Data: To change the data that the line is based on click on
the drop down menu. The options available are: High, Low, Open,
and Close.
- Style & Color: Average lines can be displayed as solid,
dashed, or dotted lines. Click on the drop down menu to specify the type
of line style. Also, next to the drop down menu is the color for the
line. Click on the color box and a color panel will open for you to
specify the new color.
- Preview Window: Use the Preview Window to view changes before they
are applied to the Track 'n Trade Pro Chart.
- Show 10x8 MAC Lines: To view the 10x8 MAC on the chart window
click in the check box. You may also select the indicator from the
shortcut buttons and the right-click menu of the indicator window.
- Restore Defaults: To restore the 10x8 MAC to the original
setting click on the Restore Defaults button.
- Documentation: Instructions and definitions for the 10x8 MAC
are available in the options screen.