Momentum
Indicator Type: Both trend following and counter trend
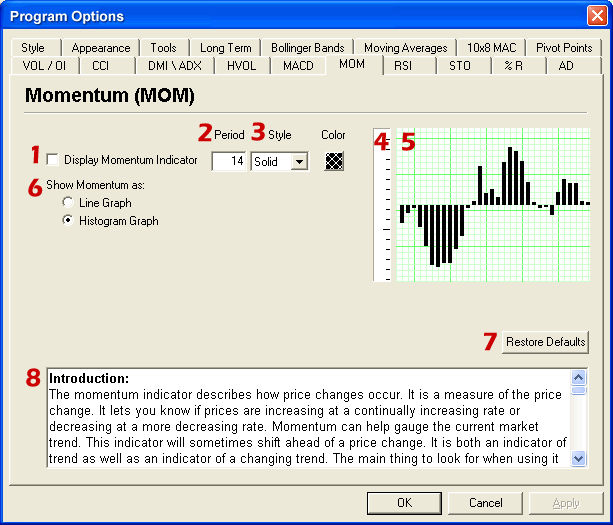
Introduction:
The momentum indicator describes how price changes occur. It is a measure of the
price change. It lets you know if prices are increasing at a continually
increasing rate or decreasing at a more decreasing rate. Momentum can help gauge
the current market trend. This indicator will sometimes shift ahead of a price
change. It is both an indicator of trend as well as an indicator of a changing
trend. The main thing to look for when using it is a divergence or difference
between price behavior and the indicators behavior.
Interpretation:
Momentum measures the rate of change in prices rather than actual price levels
themselves. By measuring this rate of incline or decline momentum tells whether
the current trend is strengthening or weakening. If prices are rising and the
momentum indicator is above the zero line then the trend is gaining strength. If
prices were rising but the indicator was sagging or went below the zero line
then we would interpret this as a sign of a coming change in trend. This is true
because although prices were still increasing they are doing so at a decreasing
rate.
The reverse would be true during a declining market. For example, think of a
race car gaining 20 miles an hour each lap, until it starts to only gain 15
miles an hour, then 10 mph, then 5 mph until eventually it reaches its top
speed. Like a race car, a market can not sustain growing momentum for ever, and
in many occurrences momentum slows before prices change direction.
Typically, the trade signals are to buy when the momentum indicator crosses from
below the zero line to above it. This indicates that a new upward trend has
begun, as the market is able to violate resistance levels and continue higher
with increasing speed.
The sell signal would be to sell when the line crosses from above the zero line
to below it. This indicates that the market is picking up speed to the downside
and should be able to violate support areas.
It is in this way that this unique indicator is a trend following tool. Another
way to use momentum is to establish regions of overbought or oversold. For
example when, in a declining market, the prices continue downward and the
momentum indicator moves toward more negative but begins to level out. We would
be looking for a buy signal when the indicator turned upward and out of that
oversold region.
It is in this way that momentum can sometimes shift ahead of the price movement.
This use of the momentum indicator is a counter trend usage.
In either implementation of this indicator the key is divergence –seeing
momentum make lower highs while prices are making higher highs or momentum
making higher lows while prices are making lower lows. Being aware of a
difference in price movement and the momentum level can help the trader make
informed trading decisions.