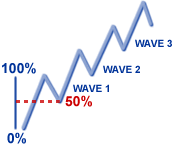
Markets move in waves called
retracements. These waves have up and down trends. Notice in the above
diagram, that the market is in an overall uptrend (considered a Bull
Market), but that within the uptrend, there are small areas where the
market falls back, or "retraces"; each time establishing a new higher
high.
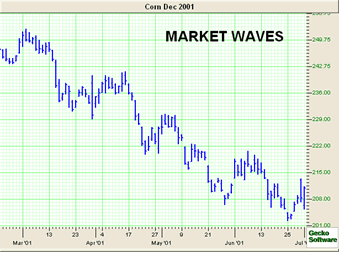
The following chart displays an example with a down trend (when a market
is in an overall down trend it is considered a Bear Market). In this
chart you will see how the market made lower highs and lower lows while
still maintaining the overall down trend.
Notice how far back those retracements went, before they continued on in
their original direction... it is about 50% of the last move.
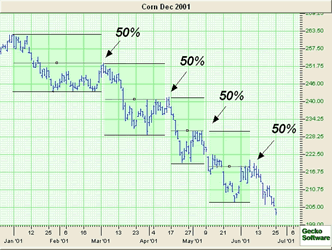
Markets have a tendency to retrace half or 50% of the last move as well
as in overall long-term trends.
Back To Top
|