Introduction
Track 'n Trade Pro has
incorporated concepts and theories from leading Technical and
Fundamental Educators in the Futures Industry allowing you as a trader
to apply their studies easily to your trading. In this section you will
learn basics about their theory and how to apply it in Track 'n Trade
Pro using the Advanced Charting Tools provided you. For more detailed
information on the different theories and concepts see the educational
products also offered by Gecko Software, Inc.
www.trackntrade.com
Elliott Wave Theory
This theory was developed by Ralph Nelson Elliott and bares his name. The
Elliott Wave Theory is an idea that market behavior is based on waves
rather than random timing. Elliott believed that market prices rose and
fell in a series of waves based on the same Golden ratio or Golden mean
that Fibonacci proved. For more information on Fibonacci, see the
Fibonacci Retracements section later in this chapter. This ratio is
present in many aspects of nature and science, and Elliott felt that it
had great significance on the financial markets as well.
Interpretation
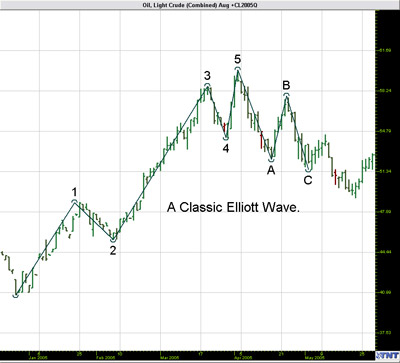
The basic idea of this theory is that a market rises in a series of 5
"waves" (as he called them) and that a market declines in a series of 3
declines. Elliott's theory is that on the first wave a market rises, on
wave two it declines, begins again to rise on wave three, has a period
of decline again on wave four, and finally completes the rise on wave
five. Then the period of correction is referred to as a three-wave
correction, where the market declines for wave A, begins to rise for
wave B, and falls again for wave C.
Elliott went on to further explain that a complete market cycle consisted
of a 144 wave cycle, broken down into an 89 wave bull cycle, and a 55
wave bear cycle. This is based on his observation of Fibonacci's Golden
Ratio. The series of numbers Fibonacci describes, (1, 2, 3, 5, 8, 13,
21, 34, 55, 89, and 144) shows a relationship of 1:.618. Elliott further
showed that a market usually rises or falls based on this wave cycle.
Each wave in the cycle has its own characteristics.
Five Wave Advance
Wave one: Normally very short and easy to miss.
Wave two: A retracement wave, usually gives back all or most of
what the first one gained.
Wave three: Usually very prominent, as it follows a period of
what appears as consolidation, most people trade this wave.
Wave four: Noted to be very intricate yet still a consolidation.
One of Elliott's main rules is that in a 5-wave advance cycle, wave 4
can't overlap wave 1.
Wave five: Often very active, yet at some point declines and
leads to the 3 wave corrective cycle.
Three Wave Decline
Wave A: Normally seen as a minor pullback, of wave 5 of the advance
cycle.
Wave B: Follows Wave A of the downtrend, and is often hard to spot but
should result in a third wave continuing down.
Wave C: Usually quiet significant and many traders see this selling
opportunity.
Trading an Elliott Wave
See Wave three in the "Five Wave Advance" and the Wave C in the "Three
Wave Decline".
Example of an Elliott Wave in Track 'n Trade Pro:
Back to Top
Elliott Wave Tool

To identify an Elliott Wave on a chart use the Elliott Wave tool located
in the Advanced Charting Tools section.
Charting an Elliott Wave:
1. Select the Elliott Wave tool from the Toolbar.
2. Left-click your mouse on the #1 point to place.
3. Continue throughout the wave by clicking on each point 1-5 and A,B,C
to place. When you get to the last point C the drawing is complete.
Resizing the Elliott Wave Drawing:
1. Select the drawing by clicking on it. Note: The drawing is selected
when boxes appear on the corners.
2. Click on one of the boxes to drag the select point and release the
mouse button.
Moving the Elliott Wave Drawing:
1. Select the drawing by clicking on it continue holding down the mouse
button.
2. Drag to the new location and release the mouse button.
Deleting the Elliott Wave Drawing:
1. Select the drawing by clicking on it and press the Del(Delete) key on
your keyboard to remove.
2. Right-click the drawing and select "Delete" from the menu.
Changing the Properties of an Elliott Wave Drawing:
Right-click on the drawing to view the Properties menu. Properties that
can be changed are:
Foreground - Changes the line color of the Elliott Wave.
Line Thickness - Changes the thickness of the Elliott Wave Line. Choose
values from 1-6.
Line Style - Changes the line style of the Elliott Wave Line. Choose from
Solid, Dashed, Dotted, and more.
Arc Thickness - Changes the arcs formed at the 1-5 and ABC points.
Choose values from 1-6.
Font - Changes the Font, Size, Style, and Color of the 1-5 and ABC
points.
Show Text - Select to view or hide the 1-5 and ABC points.
Send to Back - Changes the layer of the tool. This option is used when
more than one drawing is in the same area of the chart. Click on "Send
to Back" when you need to access a drawing under the Elliott Wave
Drawing.
Back To Top |
|