Introduction:
Wilder's DMI is similar to the historic volatility indicator in that it shows the market tendencies. The main use of this tool is to show the strength of a trend. This could direct the trader to use a trend following system or a counter trend system in their trading. It also indicates possible price reversals.
Directional Moving Index is plotted as three lines on a scale of 0 to 100. This scale is a measure of market trend. The two lines of DMI show the amount of positive and negative movement. The positive line is called D+ and the negative D-. The direction of these lines and the use of crossovers can show the changes in the current market. The key to this indicator is the ADX, or average of the difference of these two lines. The ADX is the main factor in using this indicator. During periods of extreme price variation the two lines can become very volatile; the ADX is used to compensate for this.
Interpretation:
The best application of DMI is present when used with another indicator. DMI should either confirm or contradict the indicator being used. It is also best to use DMI in long-term trade situations. Because the study is not as sensitive as other indicators it is appropriate to use it as a confirmation tool. When the DMI is advancing, the average is higher on the 0 to 100 scale, trend following systems are best employed. Likewise with a decreasing DMI average, the line is lower on the scale closer to 0, a counter trend system might be best. These traits represent the fact that as the average line goes higher in the scale the strength of the trend is gaining, and as the ADX goes lower the trend is loosing strength. It is also important to look at the individual lines for changes in price movement.
The other application for DMI is to look at the D+ and D- lines themselves. When the D+ line crosses above the D- line a buy signal is initiated. This indicates that the positive price direction is greater than the negative. Conversely, once the D+ line crosses below the D- line, a sell trigger is present. The negative price movement is overtaking the positive.
Welles Wilder himself said that he was not comfortable using these two lines by themselves. So when looking at reversals the ADX should be above both lines and once it turns lower we should see a change in market direction. One should also look to ADX for confirmation. For a good sell signal, the D+ should be greater than D- and both should be greater than ADX ( D+ > D- > ADX ). For a good buy signal, D+ should be lower than D- and both should be lower than ADX ( D+ < D- < ADX ).
This application is much the same as momentum showing a change in the market sentiment. Wilder also says that a trend following system should not be used when the ADX line is below both D lines, as this means that the market has no discernable direction.
When using the D+ and D- crossover method, Wilder stresses the use of an extreme point. On the day the crossover occurs, the extreme point is the high or low of the day, (high for a buy, and low for a sell). The market should be able to take out that price and stay beyond it for several days before the trade is initiated or exited. This use of extreme points should keep the trader from getting into whipsaws or false breakouts.
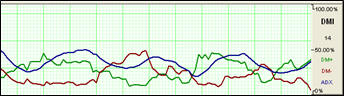
Example of the DMI in the Indicator Window:
Calculation:
Parameters:
Period (14) - the number of bars, or interval, used to calculate the study.
Show/Hide +DI (1) - this parameter is used to show or hide the +DI line. 0=hide, 1=show.
Show/Hide -DI (1) - this parameter is used to show or hide the -DI line. 0=hide, 1=show.
Show/Hide ADX (1) - this parameter is used to show or hide the ADX line. 0=hide, 1=show.
Computations:
The computations needed to generate the final figures for the DMI are not complex but are numerous and lengthy. The following discussion attempts to unravel the computational mysteries of the DMI.
If you need further explanation, please refer to the author's original work. The book titled New Concepts in Technical Trading Systems by J. Welles Wilder, Jr. explains this indicator and several others.
You must first compute the directional movement, DM, for the current trading interval. Directional movement can be up, down or zero. If directional movement is up, it is labeled as +DM. The expression -DM refers to downward directional movement.
Wilder defines directional movement as the largest part of the current trading range that is outside the previous trading range. From a mathematical view, it is the largest value of the following differences:
Hight - Hight-1 or Lowt - Lowt-1
This is only true when the current low is less than the previous low, or the current high exceeds the previous high. Please note that both of these conditions do not have to be met, only one. It is the largest portion of the trading range outside of the previous trading range.
It is possible for the directional movement to be zero. This occurs when the current trading range is inside the previous trading range, or the trading ranges, current versus previous, are equal.
Directional movement is up or positive, when the difference between the highs is the greatest. It is down or negative when the difference between the lows is the largest value. Thus, the up directional movement is +DM, and down directional movement is -DM.