Introduction
Volume is a measurement of the number of contracts traded in a day. It is a sign of market activity. Open Interest is the number of contracts outstanding or those held overnight. This is a measure of market participation. In liquid markets these numbers will be consistently higher than in a thin or illiquid market. These numbers are always a day behind, because it takes the exchange that long to tabulate these figures. When displayed Track 'n Trade offsets these values to put them beneath their respective data in the chart, consequently there is not a value for either volume or open interest for the most recent day of any contract. Volume and Open Interest indicate participation and urgency. This tells the trader which market is the correct one to be in based on its participation.
Interpretation:
Volume measures the number of contracts that changed hands during that trading session. This indicator of market activity can show whether trade was heavy or light. That will give you an idea of the possible volatility present in that market.
Contracts that have not been settled at the end of the day are represented by open interest. New buyers and sellers entering or exiting the market change open interest.
The key to this indicator is to look at volume as a percentage of open interest. VOI does not give straight buy or sell signals or have set trading rules. Rather it shows the cyclical tendencies of the market. The flow of the underlying market can be represented. Looking at VOI shows whether new buyers or sellers are entering the market or if they are liquidating positions.
There are basic common sense rules for this indicator. Prices are up and VOI is increasing, the market is strong. Prices are up and VOI is declining, the market is getting weaker. Prices are down and VOI is rising, the market is getting weaker. Prices are down and VOI is declining, the market is gaining strength.
In bull markets, volume tends to increase during rallies, and tends to decrease on reactions. In bear markets, volume tends to increase on declines and decrease during rallies. Trading volume usually increases dramatically at tops and bottoms.
Look at volume and open interest will show you which contract month to be in. When looking at trading a specific commodity it is important to know which contract month to be in. Commodities expire or are delivered several times a year. This creates a situation where traders are constantly "rolling over" from one contract month to the next. This means that traders need to know which month to be in. VOI is the tool that shows us which contract month. The months that have the highest open interest are usually the best to be in because they are the most liquid. The months that have higher volume will afford the trader a better opportunity to enter and exit the market.
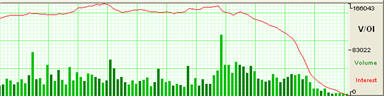
Example of V/OI in the Indicator Window:
Calculation:
This study has no computations. The values for the volume and open interest are transmitted from the exchanges. However, the actual volume and open interest figures are always one day behind price information. You will not know Monday's volume and open interest until Tuesday at approximately noon (for U.S. markets - central time). That is due to the exchanges and their reporting requirements.
Customizing:
To change the settings of this indicator, open the Program Options screen by clicking the Program Options button located on the main Toolbar. See the Program Options section for more details on changing the settings.
Displaying Indicators in the Chart Window
The Overlay Indicators are displayed in the Chart Window. To select these Indicators, right-click on the chart window and select the name of the Indicator that you would like to display on the chart.
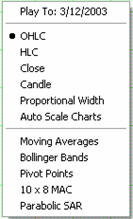 Indicators displayed in
the
Indicators displayed in
the Chart Window are the:
Moving Averages
Bollinger Bands
Pivot Points
10x8 MAC
Parabolic SAR