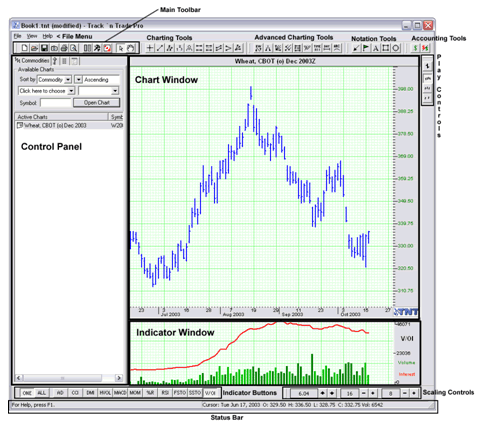
This section includes a quick look at Track 'n Trade Pro features and their
location in the software. For more information see the following sections
referenced.
File Menu - This menu consists of File, View, and Help.
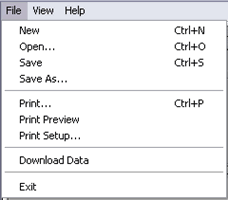
The File Menu consists of:
New: Opens a New Chartbook.
Open: Opens a Saved Chartbook.
Save: Saves the current Chartbook with existing name, if the Chartbook has been
saved. If it hasn't, the Save As window will open for you to name the Chartbook
that you are working on.
Save As: Opens the Save As window allowing you to choose a location to save the Chartbook (default My Defaults) and name the Chartbook.
Print: Prints the Chart Window. You will need to click in the Chart Window if
this option is not available.
Print Preview: Opens a window showing you what the chart will look like when it
is printed.
Print Setup: Changes the printer options before printing.
Download Data: Opens the data download utility.
Exit: Closes the Program.
See the Creating Chartbooks From Start to Finish and Data Downloads sections for
more information.
Back To Top
The View Menu - This menu controls the toolbars that are showing in the
software. Click on them to toggle on or off. If a check mark is in front of the
option, it is already selected and shown in the software.
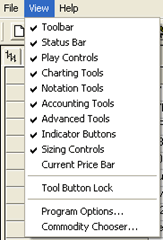
The View Menu consists of:
Tool Button Lock: This option gives you the ability to lock the tool you have
selected until you select another tool. Normally when you click on a tool, you
draw one item and then the tool ends and you are automatically defaulted to the
pointer tool.
Program Options: Select this item to open the Program Options section.
Commodity Chooser: Select this item to open the Commodity Chooser section.
See the Program Options and Data Downloads sections for more information.
Back To Top
The Help Menu - This menu gives you information about your software needed for
technical support as well as links for accessing documentation for the software.
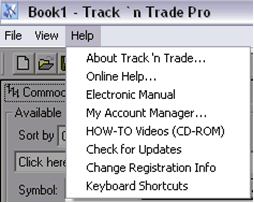
The Help Menu consists of:
About Track 'n Trade Pro:
Allows you to get information about the version
installed, the activation code, and the plug-ins installed.
Online Help: Links to http://help.geckosoftware.com
Electronic manual: Opens the manual.
My Account Manager: Opens an internet page that you can use to update your
customer information, payment information, and to place additional orders.
How-To Videos (CD-ROM): Instructions on playing videos.
Check for Updates: Checks for new updates for the software or to update your
version of the software to include any new plug-ins you may have purchased.
Change Registration Info: If you mistyped your Activation Code or needed to
change your code for any reason, this option allows you to change the Activation
code.
Keyboard Shortcuts: Allows you to get information on the quick reference list of
keyboard shortcuts for common commands.
Back To Top

Main Toolbar - This toolbar consists of quick buttons for Open, New, Save,
Capture, Print, Preview Print, Commodity Chooser, Program Options, Data
Download, Pointer and Hand Tool.
See the Creating Chartbooks from Start to Finish and Data Downloads for more
information.
Back To Top

Charting Tools - This toolbar consists of the Cross-hair, Line, Multi-Line,
1-2-3, Head & Shoulders, Channel, N%, Inclining/Declining, Wedge, and Trend Fan
Tools.
See the Analyzing Charts with Charting Tools section for more information.
Back To Top

Advanced Charting Tools - This toolbar consists of the Elliot Wave, Dart/Blip,
Gann Fan, Andrew's Pitchfork, Fibonacci Retracement, Fibonacci Arc, Fibonacci
Time Zone, Day Offset, and the Arc Tool.
See the Advanced Charting Tools section for more information.
Back To Top

Notation Tools - This toolbar consists of the Arrow, Flag, Text, Box, and Circle
Tool.
See the Personalizing Charts with Notation Tools section for more information.
Back To Top

Accounting Tools - This toolbar consists of the Dollar Calculator and the
Risk/Reward tool.
See the Calculators section for more information.
Control Panel - This panel consists of the Commodity, Key, Data and Notes Tabs.
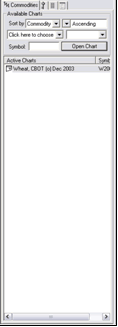
Commodity Tab: This section of the Control Panel gives you the ability to open a
chart, add a chart to your Chartbook, and to select between the charts that are
open.
See the Creating Chartbooks from Start to Finish section for detailed
information.
Key & Data Tabs: These sections display the key details and data from the
contract displayed in the Chart Window.
See the Data Download section for detailed information.
Notes Tab: This section gives you the ability to save notes with charts.
See Personalizing Charts with Notation Tools section for detailed information.
Back To Top
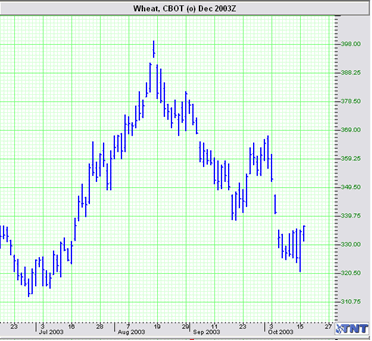
Chart Window: This section of the software displays the chart.
Play Controls: These controls consist of the center chart button, and the daily,
weekly, and monthly chart buttons.
 Center Chart Button: This button scales the price bars based on the
highest/lowest values displayed in the chart window. For more information on
Scaling, see the Creating Chartbooks from Start to Finish section. Center Chart Button: This button scales the price bars based on the
highest/lowest values displayed in the chart window. For more information on
Scaling, see the Creating Chartbooks from Start to Finish section.
Daily Chart Button: Automatically selected when opening a chart.
Weekly Chart Button: Opens a long-term weekly chart based on the daily chart
shown.
Monthly Chart Button: Opens a long-term monthly chart based on the daily chart
shown.
See the Long-Term Chart section for more information.
Back To Top

Indicator Window: This window displays the Indicators.
See the Indicators section for more information.

Indicator Buttons: Use this toolbar to select the indicators shown in the
Indicator window.
See the Indicators section for more information.
Back To Top

Scaling Controls: Gives the user quick access to changing the price bar and
ruler scaling.
See the Creating Chartbooks from Start to Finish chapter for detailed
information.

Status Bar: The status bar gives you the cursor location. You have two values
displayed:
 |
Your mouse position when your mouse pointer is over the Chart Window. |
 |
The last day shown on the chart. |
The cursor bar is also available in a floating tool bar. See the
View menu for more information.
Back To Top
|