|
Advanced Charting Tools
Fibonacci, Elliott, Gann, and More
Introduction
Gecko Software,
Inc., has incorporated concepts and theories from leading technical and
fundamental educators in the futures industry in Track ‘n Trade 5.0
allowing you as a trader to apply their studies easily to your trading.
In this section you will learn basics of their theories and how to apply
them in Track ‘n Trade 5.0 using the advanced charting tools provided
you. For more detailed information on the different theories and
concepts, see the educational products also offered by Gecko Software,
Inc., at www.trackntrade.com.
|
Elliott
Wave Theory
The
Elliott Wave theory was developed by Ralph Nelson Elliott. He
suggested that the market behavior is based on waves rather than
random timing. He believed that market prices rose and fell in a
series of waves based on the same Golden Ratio or Golden Mean
that Fibonacci proved. |
|
Interpretation
The
basic idea of the Elliott Wave theory is that a market rises in
a series of five "waves" (as he called them), and a market
declines in a series of three declines. Elliott’s said the
market rises on the first wave, declines on the second, begins
to rise again on wave three, has a period of decline again on
wave four, and finally completes the rise on wave five. The
period of correction is referred to as a three-wave correction
where the market declines for wave A, begins to rise for wave B,
and falls again for wave C.
Elliott went on to
further explain that a complete market cycle consisted of a 144
wave cycle, broken down into an 89 wave bull cycle, and a 55
wave bear cycle. This is based on his observation of Fibonacci’s
Golden Ratio. The series of numbers Fibonacci describes shows a
relationship of 1:0.618. Elliott further showed that a market
usually rises or falls based on this wave cycle. Each wave in
the cycle has its own characteristics. |
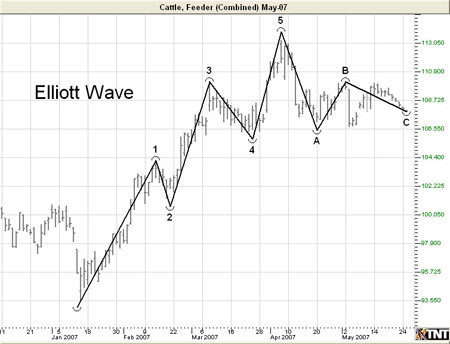
Five
Wave Advance
One: Normally very short and easy to miss.
Two: A retracement wave. Gives back all or most of what the
first one gained.
Three: Usually very prominent. Follows a period of what
appears as a consolidation, most people trade this wave.
Four: Noted to be very intricate, yet still a consolidation.
One of Elliott’s main rules is that in a five-wave advance
cycle, wave four can’t overlap wave one.
Five: Often very active. At some point declines and lead to
the three wave corrective cycle.
Three
Wave Decline
A: Normally seen as a minor pullback of wave five of the
advance cycle.
B: Follows A of the downtrend and is often hard to spot.
Should result in a third wave continuing down.
C: Usually quite significant and many traders see this as a
selling opportunity. The price bars form a perfect
symmetrical triangle shape. |
Elliott Wave
Tool

To identify an
Elliott Wave on a chart, select the Elliott Wave tool from your Advanced
Charting toolbar. Click on the first point to place. Continue throughout
the wave by clicking on each point 1-5 and ABC to place. When you get to
the last point, C, the drawing is complete.
Resizing the
Elliott Wave
Select the
drawing by clicking on it. You will know the drawing is selected when
boxes appear at the corners. Click on a box and drag it to your desired
location. Release the mouse button to place.
Moving the
Elliott Wave
Select the
drawing by clicking on it. Drag to the new location and release the
mouse button to place.
Deleting the
Elliott Wave
Select the
drawing by clicking on it. Press the Del (Delete) key on your keyboard.
You can also right-click the drawing and select "Delete" from the
dropdown menu.
Preferences
Select the
drawing by clicking on it. The properties will appear in the preferences
section of your control panel. Or, right-click on the drawing and select
properties from the dropdown menu.
Restore
Settings: TNT Default will change your settings back to the original
software settings. My Default will change current settings to your
personalized default settings. Apply To All Charts will apply your
selected settings on all open charts. Save As My Default will save your
current personal settings.
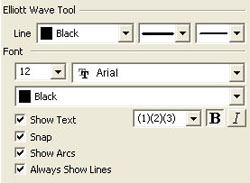 |
Elliott Wave
Tool: You can choose the color, line style, and line thickness of
your lines.
Font: Select
the font, size, and color of the text. Select Show Text to hide
or show your text on the chart.
Select Snap
to have your lines snap to price bars when moved. Select if you would
like to Show Arcs or Always Show Lines on your drawing.
|
Example of an Elliott Wave
Back To Top
|
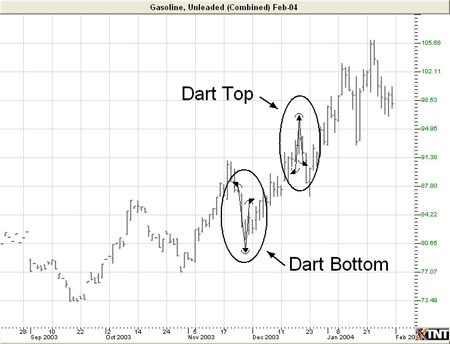
Dart/Blip Formations - Technical Analysis
The Dart/Blip formation occurs when there is a
dramatic price change which is followed by an equally dramatic
price change. |
|
Dart Up
This
formation is a sudden dramatic price increase followed by an
equally dramatic drop in price. A dart formation can appear
anywhere in a chart.
To trade
a dart up, place a sell order on the break down of the Right
Feather (RF) along with a stop loss order just above the Tip. |
 |
|
Dart
Down
This
formation is where a sudden dramatic price decrease occurs
followed by an equally dramatic increase in price. A dart
formation can appear anywhere in a chart
Place a
buy order on the break up of the Right Feather, and place a stop
loss order right below the Tip.
Trading
on a Dart Formation is extremely risky. |
 |
Dart/Blip Tool
To chart a
Dart/Blip Up or Down formation, select the Dart/Blip tool from your
Advanced Charting toolbar. Click your mouse on the Left Feather (LF).
Move to the Tip of the dart and click your mouse again. Click on the
Right Feather to finish your Dart.
Resizing the
Dart/Blip
Select the
drawing by clicking on it. You will know the drawing is selected when
boxes appear at the corners. Click on a box and drag it to your desired
location. Release the mouse button to place.
Moving the
Dart/Blip
Select the
drawing by clicking on it. Drag to the new location and release the
mouse button to place.
Deleting the
Dart/Blip
Select the
drawing by clicking on it. Press the Del (Delete) key on your keyboard.
You can also right-click the drawing and select "Delete" from the
dropdown menu.
Preferences
Select the
drawing by clicking on it. The properties will appear in the preferences
section of your control panel. Or, right-click on the drawing and select
properties from the dropdown menu.
Restore
Settings: TNT Default will change your settings back to the original
software settings. My Default will change current settings to your
personalized default settings. Apply To All Charts will apply your
selected settings on all open charts. Save As My Default will save your
current personal settings.
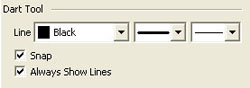 |
Dart Tool:
You can choose the color, line style, and line thickness of your lines.
Select Snap
to have your lines snap to price bars when moved. Select if you would
like to Always Show Lines on your drawing.
|
Example of a Dart Up and Down
Back To Top
|
Gann Fan Theory
W. D.
Gann designed several techniques for studying price charts. One
of these included the use of geometric angles in conjunction
with time and price. Gann believed that specific geometric
patterns and angles had unique characteristics that could be
used to predict price action.
Gann’s
techniques require that charts be drawn with equal time and
price intervals, so that a rise/run of one price unit for each
time unit (called a 1 x 1 trend or angle) will equal a 45 degree
angle anywhere on the chart. Gann believed that the ideal
balance between time and price exists when prices rise or fall
at a 45 degree angle relative to the time axis.
Interpretation
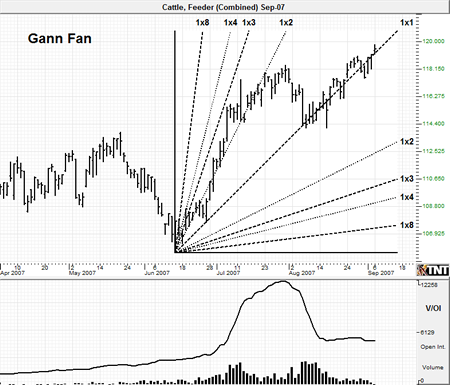
A Gann
Fan is used to define a market direction or a new trend. For
example, a bull market exists if prices are maintaining strength
between the 1x2 lower line and 1x2 higher line. A bear market
would be the exact opposite of the previous scenario. The Gann
Fan is made up of nine angles based on this concept. These trend
lines are used to indicate support and resistance levels. When
one line is broken (by the entire days price range) prices
should move to the next line. The drawing of these lines should
start from either a market top or bottom.
It is
important to note that this theory is based on a squared 45
degree angle on the chart. Obviously, a 45 degree angle drawn on
a chart is no longer 45 degrees when the scale is changed
without a change to the opposite scale as well. To "square" the
Gann Fan to the current chart’s scaled settings, hold down the
CTRL key on your keyboard while clicking and rescaling with the
mouse pointer. Some Gann experts have reported that to get a
truly "squared" chart, one must set the scaling to 8 price bars
per inch for the width and 4 price bars per inch for the height. |
Gann Fan Tool
You can apply
this theory to your charts by selecting the Gann Fan tool from your
Advanced Charting toolbar. Click where you want the Fan to start and
continue to hold down the mouse button until reaching the top-right
position of the fan. Release the mouse button to place.
Resizing the
Gann Fan
Select the
drawing by clicking on it. You will know the drawing is selected when
boxes appear at the corners. Click on a box and drag it to your desired
location. Release the mouse button to place.
Moving the Gann
Fan
Select the
drawing by clicking on it. Drag to the new location and release the
mouse button to place.
Deleting the
Gann Fan
Select the
drawing by clicking on it. Press the Del (Delete) key on your keyboard.
You can also right-click the drawing and select "Delete" from the
dropdown menu.
Preferences
Select the
drawing by clicking on it. The properties will appear in the preferences
section of your control panel. Or, right-click on the drawing and select
properties from the dropdown menu.
Restore
Settings: TNT Default will change your settings back to the original
software settings. My Default will change current settings to your
personalized default settings. Apply To All Charts will apply your
selected settings on all open charts. Save As My Default will save your
current personal settings.
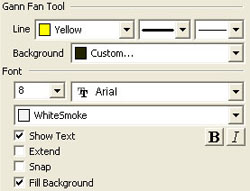 |
Gann Fan Tool:
You can choose the color, line style, and line thickness of your lines.
Select what color you want the background to be. (To make the background
transparent, deselect Fill Background at the bottom of your
preferences.)
Font: Select
the font, size, and color of the text. Select Show Text to hide
or show your text on the chart.
Select Extend
if you would like your lines to extend to the edges of your chart
window. Select Snap to have your lines snap to price bars when
moved.
|
Example of the Gann Fan
Back To Top
|
Andrews Pitchfork Theory
Dr. Alan
Andrews developed a channel technique to show areas of support
and resistance from a baseline. This use of a median line is the
key to using the Andrews Pitchfork. Buying near lows and selling
near highs that are identified by the "tines" of the pitchfork.
The basic premise is to trade the channel from one level of
support or resistance to the next. |
|
Interpretation
The
first element to draw the Andrews Pitchfork is the centerline.
The middle tine, or median line, begins at the most recent
contract low or high. To plot the direction of this point we
must attain the other two points. The top tine is determined by
looking at the highest move made from the origin of the contract
low or high. The next point is found by looking at the
retracement of that move. For example, a contract begins at
point A, rallies to point B, and sells off from point B to point
C. A line is drawn from point B to point C, and the line
originating at point A splits those two lines equally.
|
|
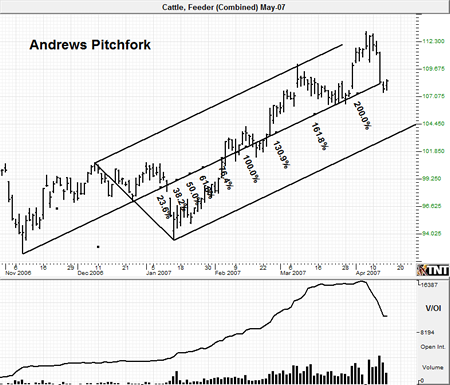
This
pitchfork shows continuing points of support and resistance. The
general use of this tool is to sell when the market rises
to line B, take profits once prices reach line A, and buy
when prices dip to line C. This series of movements within the
pitchfork affords traders the opportunity to trade a channel
system within a trending market. |
 |
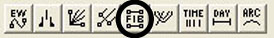
Andrews
Pitchfork Tool
You can apply
this theory to your charts by selecting the Andrews Pitchfork tool from
your Advanced Charting toolbar. Click where you want the handle of the
pitchfork to be (at the end of the previous trend). Your next two clicks
will form the base of the fork, or the tops of the next two trends. You
can elongate the pitchfork to the length desired. Click to place.
Resizing the
Andrews Pitchfork
Select the
drawing by clicking on it. You will know the drawing is selected when
boxes appear at the corners. Click on a box and drag it to your desired
location. Release mouse button to place.
Moving the
Andrews Pitchfork
Select the
drawing by clicking on it. Drag to the new location and release the
mouse button to place.
Deleting the
Andrews Pitchfork
Select the
drawing by clicking on it. Press the Del (Delete) key on your keyboard.
You can also right-click the drawing and select "Delete" from the
dropdown menu.
Drawing a Schiff
To draw a Schiff
Pitchfork (a pitchfork with the same base but with the median rooted at
one of the square markers on your two dotted angle lines), you will use
the schiff operation.
Select the drawing by clicking on it. Notice that two small square
markers will appear at the base of the pitchfork along dotted lines.
Right-click on one of the square markers and select “Add Schiff Median”
from the dropdown menu. The schiff will appear, and you can resize and
adjust the preferences as you would like.
Preferences
Select the
drawing by clicking on it. The properties will appear in the preferences
section of your control panel. Or, right-click on the drawing and select
properties from the dropdown menu.
Restore
Settings: TNT Default will change your settings back to the original
software settings. My Default will change current settings to your
personalized default settings. Apply To All Charts will apply your
selected settings on all open charts. Save As My Default will save your
current personal settings.
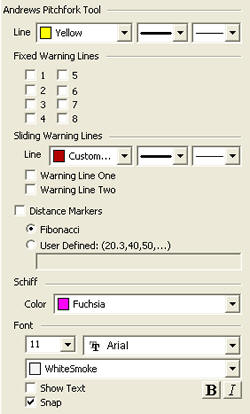 |
Pitchfork Tool:
You can choose the color, line style, and line thickness of your lines.
Extensions:
Select the boxes next to the extensions you want to add to your
pitchfork drawing. The odd numbers are placed below the main line, and
the even numbers are placed above.
Sliding
Extensions: Select to have one or two sliding extensions. Click on the
extension on your chart and drag it to where you want it. It will stay
parallel to all other extensions. You can also choose the color, line
style, and line thickness of your sliding extensions.
Distance Markers:
Select to show Fibonacci retracements, or define your own distance
markers.
Schiff Color:
Select what color you would like your Schiff drawing to be.
Font: Select
the font, size, and color of the text. Select Show Text to hide
or show your text on the chart.
Select Snap
to have your lines snap to price bars when moved.
|
Example of Andrews Pitchfork
Back To Top
|
Fibonacci
Retracements
Fibonacci Retracement levels correspond with percentage
retracements that occur in the ebb and flow of a market trend.
According to the Elliott Wave Theory, market trends tend to
occur in five distinct waves. See the Elliott Wave section for
more information. Elliott asserted that these counter-trend
waves will usually retrace against the trending waves by 38.2,
50, and 61.8 percent. These retracement percentages correspond
to natural ratios discovered by the Greeks called the Golden
Ratio and rediscovered by Fibonacci, a medieval Italian
Mathematician. |
|
 |
Interpretation
Commodity prices will frequently consist of an initial wave, a
second wave (often retracing 61.8% of the initial move), a third
wave (usually the largest), another retracement, and finally a
5th wave (the last gap), which would exhaust the movement.
In Track
‘n Trade 5.0, you have three tools that you can use to apply
these concepts: Fibonacci Retracement, Fibonacci Time Zones, and
Fibonacci Arc.
|
Fibonacci Ruler
Tool
To measure the
different retracement levels within a market, select the Fibonacci Ruler
tool from your Advanced Charting toolbar. Click on the chart where you
would like the ruler to begin. Hold the mouse button down and move to
the lower right position of the rule. Release the mouse button to place.
Resizing the
Fibonacci Ruler
Select the
drawing by clicking on it. You will know the drawing is selected when
boxes appear at the corners. Click on a box and drag it to your desired
location. Release mouse button to place.
Moving the
Fibonacci Ruler
Select the
drawing by clicking on it. Drag to the new location and release the
mouse button to place.
Deleting the
Fibonacci Ruler
Select the
drawing by clicking on it. Press the Del (Delete) key on your keyboard.
You can also right-click the drawing and select "Delete" from the
dropdown menu.
Preferences
Select the
drawing by clicking on it. The properties will appear in the preferences
section of your control panel. Or, right-click on the drawing and select
properties from the dropdown menu.
Restore
Settings: TNT Default will change your settings back to the original
software settings. My Default will change current settings to your
personalized default settings. Apply To All Charts will apply your
selected settings on all open charts. Save As My Default will save your
current personal settings.
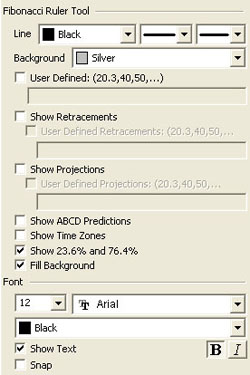 |
Fibonacci
Ruler Tool:
You can choose the color, line style, and line thickness of your lines,
as well as the color of your background. (To make transparent, deselect
Fill Background below show selections.)
Select User
Defined to enter your own values for the lines in your drawing.
Select Show Retracements or Show Projections to view
default extensions. You can also enter your own values in the User
Defined fields.
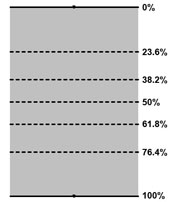
Show: You
can also choose to show ABCD Predictions, Time Zones, and
23.6% and 76.4%.
Font: Select
the font, size, and color of the text. Select Show Text to hide
or show your text on the chart.
Select Snap
to have your lines snap to price bars when moved.
|
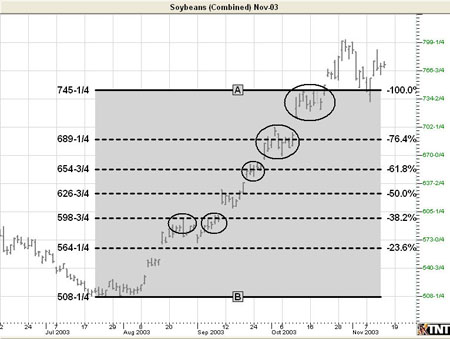
Example of a Fibonacci Retracement
Back To Top
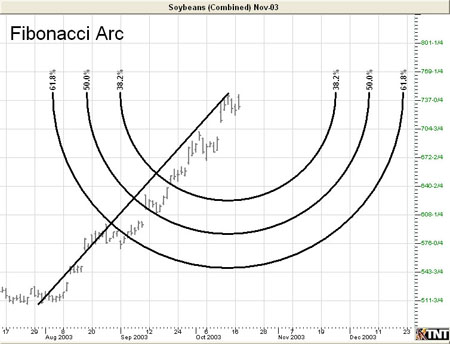
Fibonacci Arc
Tool
To measure the
different retracement levels within a market, select the Fibonacci Arc
tool from your Advanced Charting toolbar. Move the mouse pointer to the
point on the chart that will be the corner of your arc. Hold the mouse
button and drag to your end point. Release the mouse button to place.
Resizing the
Fibonacci Arc
Select the
drawing by clicking on it. You will know the drawing is selected when
boxes appear at the corners. Click on a box and drag it to your desired
location. Release the mouse button to place.
Moving the
Fibonacci Arc
Select the
drawing by clicking on it. Drag to the new location and release the
mouse button to place.
Deleting the
Fibonacci Arc
Select the
drawing by clicking on it. Press the Del (Delete) key on your keyboard.
You can also right-click the drawing and select "Delete" from the
dropdown menu.
Preferences
Select the
drawing by clicking on it. The properties will appear in the preferences
section of your control panel. Or, right-click on the drawing and select
properties from the dropdown menu.
Restore
Settings: TNT Default will change your settings back to the original
software settings. My Default will change current settings to your
personalized default settings. Apply To All Charts will apply your
selected settings on all open charts. Save As My Default will save your
current personal settings.
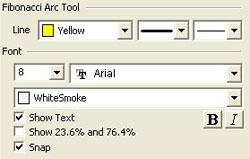 |
Fibonacci Arc Tool:
You can choose the color, line style, and line thickness of your lines.
Font: Select
the font, size, and color of the text. Select Show Text to hide
or show your text on the chart.
Select Show
23.6% and 76.4% to view these two additional arc lines. Select
Snap to have your lines snap to price bars when moved.
|
Example of a Fibonacci Arc
Back To Top
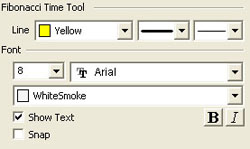
Fibonacci Time
Zones
The Fibonacci
Time Zone uses Fibonacci numbers rather than the percentages used in the
Ruler and Arc tools. Select the Fibonacci Time Zones from your Advanced
Charting toolbar. Click where you want the upper left point. Hold the
mouse button and drag to the bottom right position. Release the mouse
button to place.
Resizing the
Fibonacci Time Zones
Select the
drawing by clicking on it. You will know the drawing is selected when
boxes appear at the corners. Click on a box and drag it to your desired
location. Release the mouse button to place.
Moving the
Fibonacci Time Zones
Select the
drawing by clicking on it. Drag to the new location and release the
mouse button to place.
Deleting the
Fibonacci Time Zones
Select the
drawing by clicking on it. Press the Del (Delete) key on your keyboard.
You can also right-click the drawing and select "Delete" from the
dropdown menu.
Preferences
Select the
drawing by clicking on it. The properties will appear in the preferences
section of your control panel. Or, right-click on the drawing and select
properties from the dropdown menu.
Restore
Settings: TNT Default will change your settings back to the original
software settings. My Default will change current settings to your
personalized default settings. Apply To All Charts will apply your
selected settings on all open charts. Save As My Default will save your
current personal settings.
 |
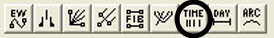
Fibonacci Time
Tool: You can choose the color, line style, and line thickness of
your lines.
Font:
Select the font, size, and color of the text. Select Show Text to
hide or show your text on the chart.
Select Snap
to have your lines snap to price bars when moved.
|
Example of a Fibonacci Time Zone
Back To Top
|
Calculating
Trading vs. Actual Days
I n
the futures industry trading, days are scheduled around holidays
and weekends. When looking at a futures chart, it is difficult
to determine how many actual days have passed while working a
trade.
The
number of trading days is also significant for traders using the
number of trading days as a rule in conjunction with a
formation. For example with the 123 Top or Bottom formation,
many traders use the 10-20-50 rule. This rule defines a 123 if
there are 10 trading days between the #1 and #2, and 10 days
between the #2 and #3 points.
To
calculate the actual, or trading, days on a chart, use the Day
Offset Tool.
Days "Higher" and "Lower"
Another
statistic used alongside formations and other theories is the
day higher and lower calculation. This calculation determines
how many days, in a defined set of price bars, were "higher" or
"lower." A day is considered a "Higher Day" if the close is
higher than any previous close in the set of price bars
selected. Conversely, a day is considered a "Lower Day" if the
close is lower than any previous trading day in the defined set
of price bars. |
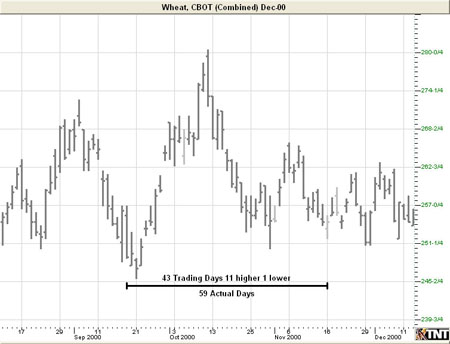
Day Offset Tool
The Day Offset
tool enables you to measure the number of trading days versus actual
days that are between two points on the chart. Also calculated on this
tool is the number of days that the market closed high or lower in
comparison with the previous day. Select the Day Offset tool from your
Advanced Charting toolbar. Click where you would like to start and drag
the horizontal line to where you would like it to end. Release the mouse
button to place.
Resizing the Day
Offset
Select the
drawing by clicking on it. You will know the drawing is selected when
boxes appear at the corners. Click on a box and drag it to your desired
location. Release the mouse button to place.
Moving the Day
Offset
Select the
drawing by clicking on it. Drag to the new location and release the
mouse button to place.
Deleting the Day
Offset
Select the
drawing by clicking on it. Press the Del (Delete) key on your keyboard.
You can also right-click the drawing and select "Delete" from the
dropdown menu.
Preferences
Select the
drawing by clicking on it. The properties will appear in the preferences
section of your control panel. Or, right-click on the drawing and select
properties from the dropdown menu.
Restore
Settings: TNT Default will change your settings back to the original
software settings. My Default will change current settings to your
personalized default settings. Apply To All Charts will apply your
selected settings on all open charts. Save As My Default will save your
current personal settings.
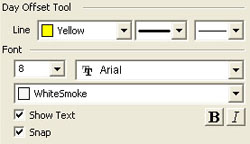 |
Day Offset Tool:
You can choose the color, line style, and line thickness of your line.
Font: Select
the font, size, and color of the text. Select Show Text to hide
or show your text on the chart.
Select Snap
to have your lines snap to price bars when moved.
|
Example of the Day Offset Tool
Back To Top
|
Rounded Top &
Bottom Formations
The
Rounded Top & Bottom formation is a very gradual change in
trend. |
|
 |
Rounded Top
The
Rounded Top formation consists of a gradual change in trend from
up to down. |
|
 |
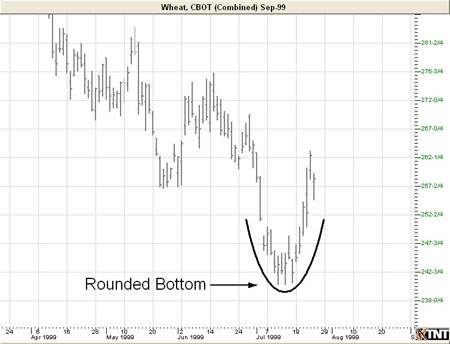
Rounded Bottom
The
Rounded Bottom formation consists of a gradual change in trend
from down to up. This formation is the exact opposite of a
Rounded Top Formation. |
|
 |
Double Top
This
formation includes two distinct "tops" and anticipates a change
in trend from up to down. |
|
 |
Double Bottom
This
formation includes two distinct "bottoms" and anticipates a
change in trend from down to up. This formation is the exact
opposite of a Double Top. |
|
 |
Triple Top
This
formation includes three distinct "tops" and anticipates a
change in trend from up to down. |
|
 |
Triple Bottom
This
formation includes three distinct "bottoms" and anticipates a
change in trend from down to up. This formation is the exact
opposite of a Triple Top. |
Arc Tool
To illustrate a
Rounded top or bottom formation on your futures chart, select the Arc
tool in your Advanced Charting toolbar. Move the mouse pointer to the
point on the chart that will be the corner of your arc. Hold the mouse
button and drag to your end point. Release the mouse button to place.
Resizing the Arc
Select the
drawing by clicking on it. You will know the drawing is selected when
boxes appear at the corners. Click on a box and drag it to your desired
location. Release the mouse button to place.
Moving the Arc
Select the
drawing by clicking on it. Drag to the new location and release the
mouse button to place.
Deleting the Arc
Select the
drawing by clicking on it. Press the Del (Delete) key on your keyboard.
You can also right-click the drawing and select "Delete" from the
dropdown menu.
Preferences
Select the
drawing by clicking on it. The properties will appear in the preferences
section of your control panel. Or, right-click on the drawing and select
properties from the dropdown menu.
Restore
Settings: TNT Default will change your settings back to the original
software settings. My Default will change current settings to your
personalized default settings. Apply To All Charts will apply your
selected settings on all open charts. Save As My Default will save your
current personal settings.
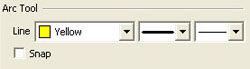 |
Arc Tool:
You can choose the color, line style, and line thickness of your line.
Select Snap
to have your lines snap to price bars when moved.
|
Example of the
Arc Tool
Back To Top
|