|
Bulls 'n Bears Plug-in
Red Light, Green Light, Blue Light
Trading System
Introduction
Bulls ‘n Bears
is the first trading system designed for Track ‘n Trade 5.0 users. This
trading system includes easily usable tools to see if the market is
bullish or bearish. Bulls ‘n Bears allows you to change the sensitivity
of the system according to your trading style; whether you are an
aggressive trader, or a more traditional trader.
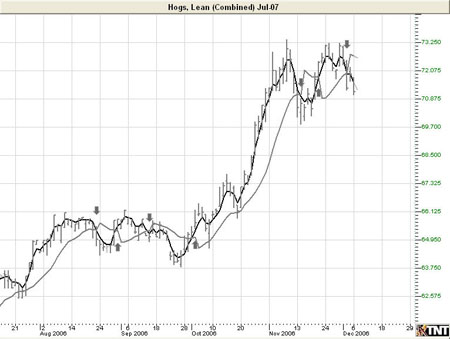
With the Bulls
‘n Bears Red Light, Green Light, Blue Light trading method/system you
have simple to understand entry and exit signals displayed visually on
the chart.
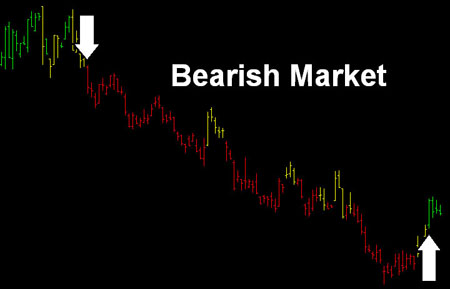
Red Light (Bearish Trend)
Indicates the beginning of a bearish trend,
and that the contract has started to move downward; therefore
identifying a possible short entry point.
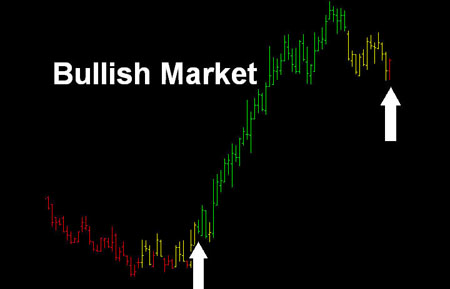
Green Light (Bullish Trend)
Indicates the
trend of a market has begun to move upward, identifying a possible long
entry point.
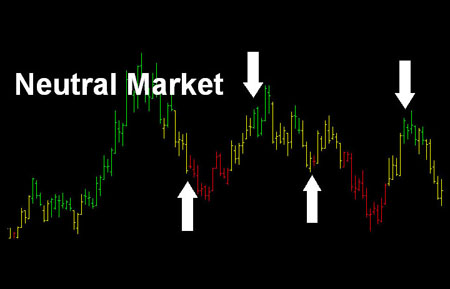
Yellow Lights (Neutral or Sideways Trend)
Indicates the
trend of the market has entered a sideways or neutral time frame.
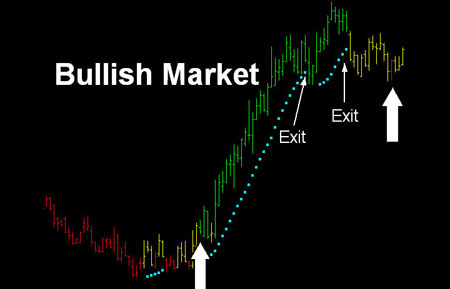
Blue Lights
(Stop Loss Placement)
The Parabolic
stop is used within the Bulls ‘n Bears system as the key point for
managing your stop loss risk while trading; helping you to identify exit
and stop loss placement points after entering a trade.
Back To Top
Preferences
Open the
Preference tab from the Control Panel on the left of your screen.
Right-click on your chart and highlight "Overlay Properties" from the
dropdown menu. Select Bulls ‘n Bears from the list and the preferences
will appear in the Control Panel. (Once you click on the chart, the
Preference tab will go back to chart settings.)
Restore
Settings: TNT Default will change your settings back to the original
software settings. My Default will change current settings to your
personalized default settings. Apply To All Charts will apply your
selected settings on all open charts. Save As My Default will save your
current personal settings.
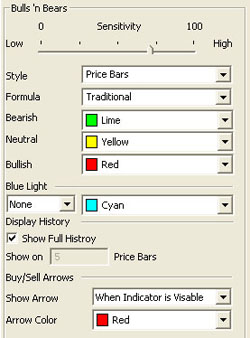 |
Sensitivity:
Adjust what you would like the sensitivity level to be.
Style:
Select Lines, Dots, Crosses, Squares, or Price Bars from the dropdown
menu.
Formula:
Select Traditional, Progressive, or Aggressive from the dropdown menu.
Bearish,
Neutral, Bullish: Select what color you would like each
indicator to be.
Blue Light:
Select to display the blue light on a Bearish or Bullish market and what
color you would like it to appear.
Display History:
Check if you would like to show Full History or specify how many price
bars.
Choose when you want
Buy/Sell Arrows to show and what color.
|
Back To Top
Advantage Lines Indicator
Advantage lines
were created in an attempt to help eliminate whipsaw from a short-term
moving average trading system. The main advantage of a short term moving
average trading system is that it provides early entry signals to
potential trading opportunities and trend reversals. This is also the
disadvantage to the same system.
Due to the early
entry notification, you receive a lot of false signals, better known as
whipsaw. To help eliminate many of these false signals, Mr. Turner
created the Advantage Lines, which significantly help in reducing
whipsaw, but also somewhat delayed the early entry signals. To enhance
and help in getting back the early entry signals, the "projection" part
of this indicator actually projects forward where we anticipate
tomorrow’s lines to be, and let us know if we are "anticipating" a
crossover or not.
Example of Advantage Lines
Preferences
Open the
Preference tab from the Control Panel on the left of your screen. Select
the Advantage Line on your screen. The preferences will appear in the
Control Panel. (Once you click on the chart, the Preference tab will go
back to chart settings.)
Restore
Settings: TNT Default will change your settings back to the original
software settings. My Default will change current settings to your
personalized default settings. Apply To All Charts will apply your
selected settings on all open charts. Save As My Default will save your
current personal settings.
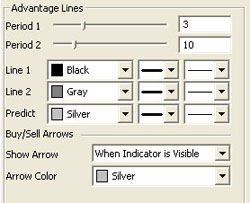 |
Period
1,2: Specify your periods by dragging the slider up or down.
Lines:
Choose the color, line style, and line thickness of your lines.
Choose when you
want Buy/Sell Arrows to show and what color.
|
Back To Top
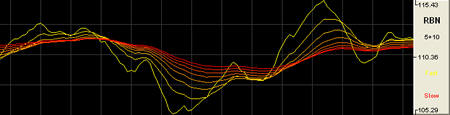
Ribbon Indicator
The Ribbon Indicator is a series of moving averages lines used to
identify trends. By placing 8 moving averages calculated
with differing time periods onto the same chart, we can see the relative
strength of a market trend. The indicator is very useful in highlighting
and confirming trend changes with the Bulls ‘n Bears Trading System.
Convergence and Divergence
The most important signals are taken from the spacing between the Ribbon
lines in each group, not from crossovers. When shorter-term lines
(yellow) and longer-term lines (red) within a group are parallel and
close together, the group are largely in agreement. When the Ribbon
lines widen apart, this signals divergent views within the group. When
Ribbon lines converge, this is a sign that the group view is changing.
Trend Strength
Parallel long-term Ribbon lines signal long-term investor support and a
strong trend; and short-term Ribbon lines tend to bounce off the
long-term Ribbon lines group.
Trend Weakness: Both groups of Ribbon lines converge and
fluctuate more than usual.
Trend Start: A change in price direction accompanied by expanding
Ribbon lines in both groups.
Short-Term Reversals: The short-term group crossover, diverge and
then again converge; while the long-term group remain parallel.
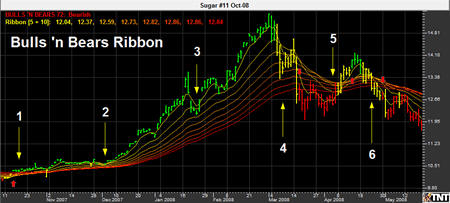
1. Short-term retracement gives a long entry signal
2. Another short-term retracement
3. Moving averages diverge, increasing the risk of a
reversal
4. Strong retracement indicated changing short and
medium-term views, but long-term view holds firm
5. Short-term retracement signals recovery
6. Moving averages diverge, warning of another
reversal
The Ribbon Indicator is unique in Track 'n Trade
because it can be viewed both in the indicator window or as a chart
overlay.
Example of Ribbon in
Indicator Window
Preferences
Open the
Preferences Tab in your Control Panel. Select the RBN quick link at the
right of the indicator window. (Once you click on the chart, the
Preference tab will go back to chart settings.)
Restore Settings: TNT Default will change your settings back to the
original software settings. My Default will change current settings to
your personalized default settings. Apply To All Charts will apply your
selected settings on all open charts. Save As My Default will save your
current personal settings.
 |
Base Length: Specify the period of the first and "fastest" moving
average.
Increment/Multiplier: Specify the number by which the 7
additional moving averages periods will be incrementally calculated.
Fast Color: Specify the color of the fastest moving average line.
Slow Color: Specify the color of the slowest moving
average line.
Lines Style: Choose the line style and thickness of your
indicator line.
|
Back To Top
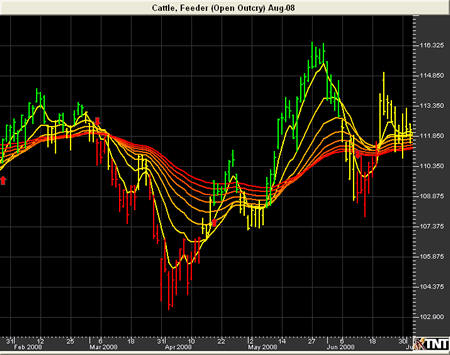
Ribbon Overlay
Indicator
The Ribbon Overlay Indicator functions by
the same principles as the Ribbon Indicator, but is displayed as an
overlay in the chart window.
Example of Ribbon
Overlay
Preferences
Right-click anywhere on the chart and go to “Overlay Properties.” Select
Ribbon from the list. The preferences will appear in the Control Panel.
(Once you click on the chart, the Preference tab will go back to chart
settings.)
Restore Settings: TNT Default will change your settings back to the
original software settings. My Default will change current settings to
your personalized default settings. Apply To All Charts will apply your
selected settings on all open charts. Save As My Default will save your
current personal settings.
 |
Base Length:
Specify the period of the first and "fastest" moving average.
Increment/Multiplier:
Specify the number by which the 7 additional moving averages periods
will be incrementally calculated.
Fast Color:
Specify the color of the fastest moving average line.
Slow Color:
Specify the color of the slowest moving
average line.
Lines Style:
Choose the line style and thickness of your
indicator line.
|
Back To Top
|