|
Using Calculators
Calculators Made Easy
Introduction
Track ‘n Trade
5.0 has included the Dollar calculator and the Risk/Reward calculator to
help simplify the trading process. With both the Dollar Calculator and
the Risk/Reward Calculator, simply click and drag between two locations
on the chart to instantly know the dollar value between the two points.
Dollar Calculator

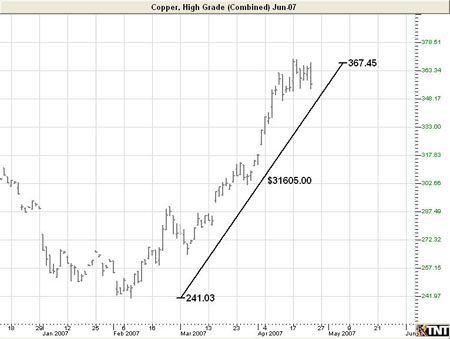
Used the Dollar
calculator to find the dollar value between two points on the chart.
Select the Dollar calculator tool from your Calculators toolbar. Click
on your chart where you want the calculator to start and drag to where
you want the calculation to be completed. Release the mouse button to
place. The dollar amount of the chart movement will be calculated from
the beginning and end point values and will be displayed in the center
of the line.
Example of the Dollar Calculator
Resizing the
Dollar Calculator
Select the
drawing by clicking on it. You will know the drawing is selected when
boxes appear at the corners. Click on a box and drag it to your desired
location. Release the mouse button to place.
Moving the
Dollar Calculator
Select the
drawing by clicking on it. Hold down the mouse button and drag to the
new location. Release the mouse button to place.
Deleting the
Dollar Calculator
Select the
drawing by clicking on it. Press the Del (Delete) key on your keyboard.
You can also right-click the drawing and select "Delete" from the
drop-down menu.
Preferences
Select the
drawing by clicking on it. The properties will appear in the preferences
section of your control panel. Or, right-click on the drawing and select
properties from the dropdown menu.
Restore
Settings: TNT Default will change your settings back to the original
software settings. My Default will change current settings to your
personalized default settings. Apply To All Charts will apply your
selected settings on all open charts. Save As My Default will save your
current personal settings.
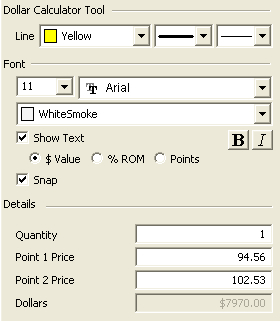 |
Dollar Calculator Tool: Choose the color, line style, and line
thickness of your line.
Select how you would like to view the values on your
dollar calculator. $ Value will show you the size of the move in
dollars (points x point value). %ROM stands
for Return on Move and calculates the percentage return received for a
given move. Points will show you the size of the move in points.
Font: Select the font, size, and color of the text. Select Show
Text to hide or show your text on the chart.
Quantity:
Select the number of contracts for which you wish to calculate the
value. The default
quantity is one.
|
Back To Top
Risk/Reward
Calculator

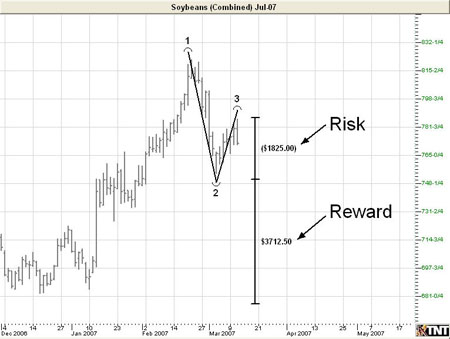
The Risk/Reward
calculator is used to find the difference between two points of the risk
and reward zone. Select the Risk/Reward tool on your Calculators
Toolbar. Click on your chart where you want your technical formation to
begin and drag to cover the area between your initial order and your
risking stop loss order.
The calculator
will create an equal-sized reward area that can be stretched to the
proper distance you expect the graph to retrace. The numbers in the tool
indicate the dollar amount of risk and reward.
When the chart
is trading within the risk area (negative number), you are risking your
own money. When the chart is trading within the reward area (positive
number), you are risking OPM or "Other People’s Money." Use the
Risk/Reward calculator on all trades to calculate where your order
entries and exits should be placed.
Example of the Risk/Reward Calculator
Resizing the
Risk/Reward Calculator
Select the
drawing by clicking on it. You will know the drawing is selected when
boxes appear at the corners. Click on a box and drag it to your desired
location. Release the mouse button to place.
Moving the
Risk/Reward Calculator
Select the
drawing by clicking on it. Hold down the mouse button and drag to the
new location. Release the mouse button to place.
Deleting the
Risk/Reward Calculator
Select the
drawing by clicking on it. Press the Del (Delete) key on your keyboard.
You can also right-click the drawing and select "Delete" from the
drop-down menu.
Preferences
Select the
drawing by clicking on it. The properties will appear in the preferences
section of your control panel. Or, right-click on the drawing and select
properties from the dropdown menu.
Restore
Settings: TNT Default will change your settings back to the original
software settings. My Default will change current settings to your
personalized default settings. Apply To All Charts will apply your
selected settings on all open charts. Save As My Default will save your
current personal settings.
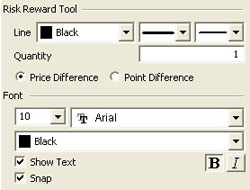 |
Risk
Reward Tool: Choose the color, line style, and line thickness of
your line.
Quantity:
Select how many contracts you would like to be calculated.
Price/Point
Difference: Select whether you want the tool to calculate between
price or points.
Font: Select
the font, size, and color of the text. Select Show Text to hide
or show your text on the chart.
Select Snap to have
your lines snap to price bars when moved.
|
Back To Top
|