|
|
Commitment of Traders
Know What the Industries are Trading
Introduction
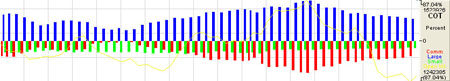
In this graph,
the lighter (red) bars, that represent the commercials, are all selling,
or going short, while the trend of the market is going up. The
commercials are using the futures market to "hedge" either the cash
market, or their current inventory, by going short, or selling, during
an uptrend.
The darker
(blue) lines, that represent the large speculators, are following the
trend of the market more closely. That is because they are speculators,
not hedgers. When the market goes up, the large speculators go long, or
buy the market in an attempt to capture profits from buying low and
selling high. But the commercials go short in an attempt to price
protect their cash crop or inventory.
The small
(green) bars represent the small speculators. Generally, the large
speculators and the professional traders will use the small speculators
as a contrarian indicator. If the small speculators are all buying the
market (lines extend above the zero line), then the professionals begin
to sell. If the small speculators say sell, then the professionals
consider being a buyer. (This is not always true, but unfortunately for
the small speculator, it is more true than not.)
The best thing
about COT is that it is not based on the market’s price. The JBCOT (Jake
Bernstein proprietary buy/sell indicator) does not even take the markets
price into account. This is strictly an indicator that looks at what the
largest industry players are doing, and then simply points out their
actions.
The COT reports
provide a breakdown of each Tuesday’s open interest for markets in which
20 or more traders hold positions equal to or above the reporting levels
established by the CFTC. The weekly reports for Futures-Only Commitments
of Traders and for Futures-and-Options-Combined Commitments of Traders
are released every Friday at 3:30 p.m. Eastern time.
Back To Top
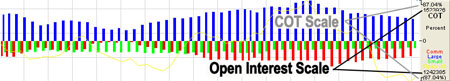
COT in the Indicator Window
When shown in
the Indicator Window, the outer most numbers are the range of the
largest of the three commitment of traders (Commercial, Large, and
Small). The inner numbers are the range of the Open interest of all of
the commitment of traders.
Displaying the
Commitment of Traders Indicator
Click on the COT
button located in your Indicators Toolbar.
Back To Top
Preferences
Open the
Preference tab from the Control Panel on the left of your screen. Select
COT from the Indicators Toolbar. The preferences will appear in the
Control Panel. (Once you click on the chart, the Preference tab will go
back to chart settings.)
Restore
Settings: TNT Default will change your settings back to the original
software settings. My Default will change current settings to your
personalized default settings. Apply To All Charts will apply your
selected settings on all open charts. Save As My Default will save your
current personal settings.
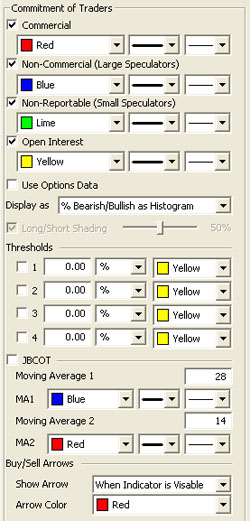 |
Lines:
Select the color, type, and thickness of your lines.
Display as:
Bearish/Bullish displays COT by calculating the number of Long
positions minus the number of Short positions. If it is positive, more
trades are long. If it is negative, more trades are short. If it is
zero, they are equal. Long & Short Positions display COT as a
stacked column. The long position number on top and the short position
number on bottom.
Thresholds:
View up to four thresholds at a value that you type in and a color that
you choose.
JBCOT:
Select if you would like to view the JBCOT lines.
Moving Averages:
Specify the number of weeks used in calculating the JBCOT buy/sell
indicator. Select the color, type, and thickness of your line.
Select when you
would want Buy/Sell Arrows to show and what color.
|
Back To Top
|