|
|
Getting Started
Navigating Your New Software
Installation
Whether you
purchased Track ‘n Trade 5.0 by downloading it from the internet or to
be installed by CD-ROM, your installation process will be the same. The
installer will guide you through the steps required to install Track ‘n
Trade 5.0 on your computer.
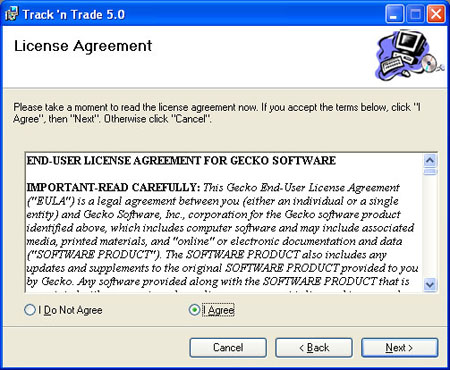
EULA
Please read
through the End-User License Agreement. If you agree to the terms of
use, select the circle next to "I Agree" and you will be able to click
Next to view the next window.
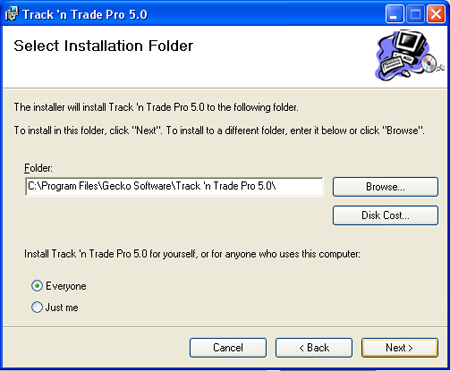
Location
Read the
instructions and select which installation process you would like to
follow, and where to install it on your computer’s hard drive if that is
your choice. Then select the shortcuts you would also like to install.
Click the Next button when you are finished.
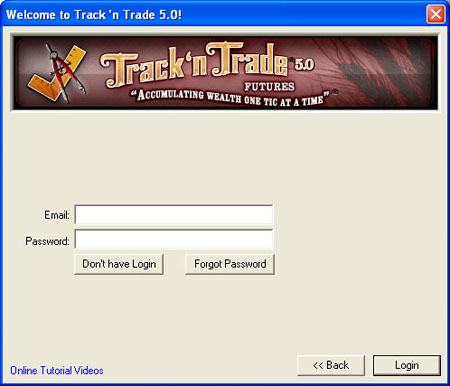
Log-in
The Welcome
window will appear the first time you open Track ‘n Trade 5.0. Select
whether you own Track ‘n Trade 5.0 or if you are using a trial version.
Enter your username and password on the next page.
If you were
already a customer of Gecko Software when you purchased Track ‘n
Trade 5.0, use the same username and password from your Account
Manager.
If you
purchased Track ‘n Trade 5.0 by phone, your username and password
will be in your confirmation email.
If you
purchased Track ‘n Trade 5.0 online, use the username and password
you set up.
Saving Username
and Password
The option to
save your username and password is available in Track ‘n Trade 5.0.
Remember, logging in gives you access to your financial information
through Track ‘n Trade 5.0, and others may use these saved passwords to
access this information.
Back To Top
Account Manager
The Account
Manager was created to give Gecko Software customers a convenient
resource to update their personal information with us, such as your
billing, shipping, and payment information.
To access the
Account Manager, log-in to Track ‘n Trade 5.0, click on the Help Menu,
and select Account Manager. The Account Manager will open in your
default browser. (You will not need to enter your email address and
password if you are already logged-in to the program.)
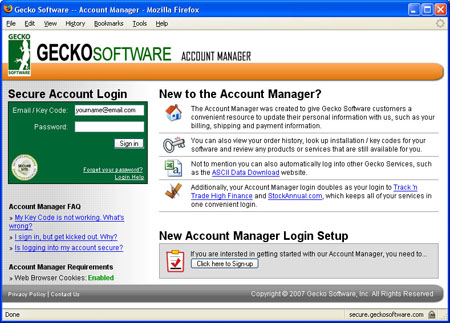
Or, access your
Account Manager by visiting www.trackntrade.com or www.geckosoftware.com
and click on Account Manager. To log-in to the Account Manager, use the
same username and password you use to access the Track ‘n Trade 5.0
software program. There are links below the log-in to help you in case
you forget this information. If you do not have a password, click on the
"Click Here to Sign-Up" button on the bottom of the screen. It is
helpful to read the information given here.
Once you have
logged in, a screen will appear with your information on it. The top of
the screen is a menu with Home, Update Account, Order History, and
Available Products tabs.

From the Home
page you can view your Account Details at the top left corner, which
include your current address and phone number. You can change this
information by clicking Review. You will also see any Account Notices,
such as a notice that one of your subscriptions needs to be renewed.
Below will be a list of your current subscriptions and a list of the
software programs you currently own.
The Update
Account page is where you can update your Billing and Contact
Information, Shipping Information, Payment Information, and your
Password. It is important to keep this information up-to-date.
On the Order
History page, there will be a chronological list of all your orders.
To view them in detail, click on the Details link on the right side of
the screen.
The last page on
the menu is Available Products. Here you can view all the Gecko
Software products you do not own. Please browse through and make
purchases from this window.
Back To Top
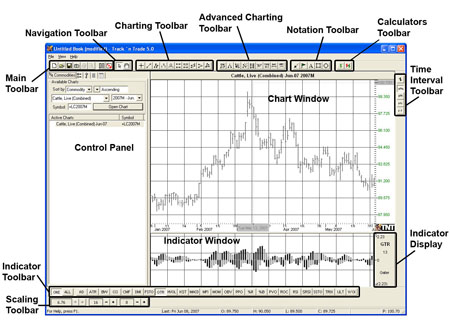
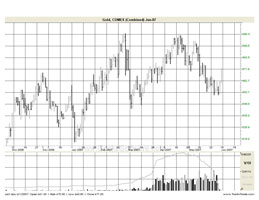
Getting Started
This section
will introduce you to the basic functions and features of Track ‘n Trade
5.0. First we’ll take a look at your workspace. The screenshot below is
what you will see when you open Track ‘n Trade 5.0. Use this as a
reference for the rest of the manual. The following pages will explain
each Toolbar and Menu labeled here and their functions.
Back To Top
Keyboard Shortcuts
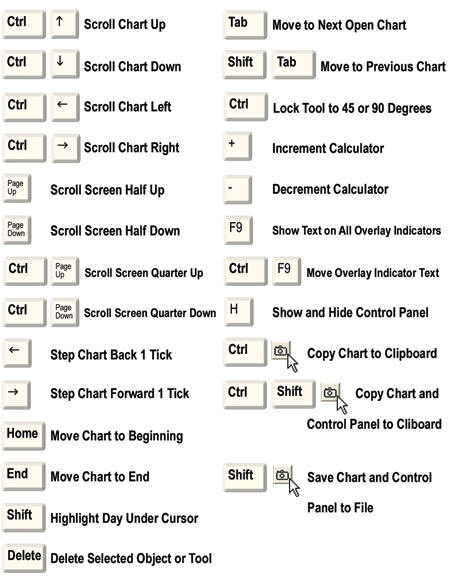
Back To Top
File Menu
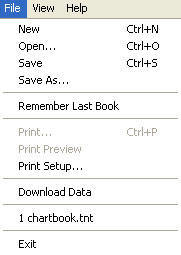 |
Open a new blank chartbook by clicking on New, or open an already
saved chartbook by clicking on Open.
Save the current
chartbook with existing name by clicking Save. If the chartbook
hasn’t been saved, the Save As window will open for you to name the
chartbook that you are working on. Clicking on Save As will open
the same window.
Remember Last
Book will load the last chartbook you had open. The last eight
chartbooks you have opened are listed below Data Download.
Print the chart
window by selecting Print. Print Preview will open a
window showing what the chart will look like when it is printed.
Print Setup gives options for printing the chart.
Download Data
will open the Data Download window in your browser.
Exit
closes the program.
|
|
View Menu
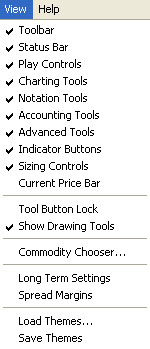 |
Use this
dropdown menu to select which toolbars you would like to appear on your
screen. The toolbar is selected when a checkmark appears beside it.
Toolbars you can choose to show or hide are Main Toolbar,
Status Bar, Play Controls, Charting Tools, Notation
Tools, Accounting Tools, Advanced Tools, Indicator
Buttons, Sizing Controls, and Current Price Bar.
You may also
select Tool Button Lock that gives you the ability to use the
tool you have selected an unlimited amount until you select another
tool. If this option is not selected, your tools will only last for one
drawing and default back to the pointer tool. Deselecting Show
Drawing Tools will hide any drawn tools on your chart.
The Commodity
Chooser option will open the Commodity Chooser window. Select
Long Term Settings to customize your long term charts or select
Spread Margins to open the spread margins window.
Load and
Save Themes explained below.
|
|
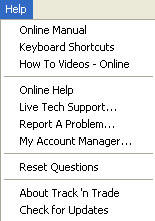
Help Menu
|
Online
Manual, Keyboard Shortcuts, How To Videos, Online
Help, Report A Problem, and My Account Manager
will open a window in your browser and link you to the
appropriate website.
When you click on Live Tech Support, a
pop up window will direct you to call Gecko Software, Inc., at
the appropriate phone number (435-752-8026). The tech support
will give you a meeting ID that you can type into the
appropriate box.
There are times when you will receive a pop up
window asking if you want to finish an action (such as deleting
a chart). If you select "Don’t ask me again" in the window, you
won’t receive the notification next time you complete the same
action. By selecting Reset Questions, you will start
receiving all pop up windows again.
Clicking on About Track ‘n Trade will
open a window with information about the version installed, the
activation code, and the plug-ins installed.
Click on Check for Updates for new
updates for the software or to update your version of the
software to include any new plug-ins you may have purchased. |
Back To Top
Main Toolbar
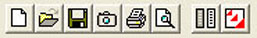
New: Closes
your current chartbook and opens a new blank chartbook.
Open:
Closes your current chartbook and opens a window for you to
choose a previously saved chartbook.
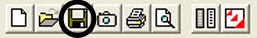
Save:
Saves your open charts as a chartbook.
Screen
Capture: Saves your open chart as an image. Shift-click
saves your chart window plus your control panel. (Ctrl-click copies the
screenshot to your clipboard and makes it ready to paste. Shift-Ctrl
will copy your chart window plus your control panel.)
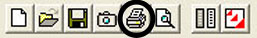
Print:
Prints the chart window.
Print
Preview: Opens a window showing what the chart will look
like when its printed.
Commodity Chooser: Opens the Commodity Chooser window.
Data
Update: Opens the Data Download window in your browser.
Navigation Toolbar

Pointer:
Default tool used for selecting tools and features in the software.
Scrolling Hand:
Used in chart window to click and drag a chart.
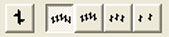
Charting Toolbar
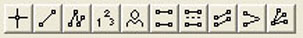
Crosshair:
Used to draw a line vertically and horizontally on a chart.
Line: Used
to draw support and resistance lines.
Multi-Line:
Used to draw an alternating support and resistance line.
123: Used to
chart a 123 top or bottom formation.
Head and
Shoulders: Used to chart a Head & Shoulders top or bottom formation.
Narrow Sideways
Channel: Used to identify a horizontal channel.
N% Ruler:
Used to measure a retracement.
Inclining/Declining Channel: Used to identify an inclining or
declining channel.
Wedge: Used
to identify any type of wedge or triangle.
Trend Fan:
Used to identify a trend fan.
Advanced
Charting Toolbar
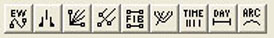
Elliott
Wave: Used to chart an Elliott Wave.
Dart/Blip: Used to identify a Dart/Blip.
Gann
Fan: Used to chart a Gann Fan.
Andrews
Pitchfork: Used to chart an Andrews Pitchfork.
Fibonacci Retracement: Used to measure a Fibonacci
Retracement.
Fibonacci Time Zones: Used to measure a Fibonacci Time Zone.
Day
Offset: Used to measure the number of trading days versus
actual days between two points.
Arc:
Used to identify a rounded top or bottom formation.
Notation Toolbar
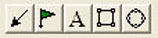
Notation Arrow:
Used to draw arrows to help point out areas of interest.
Flag: Used
to place a flag or graphic.
Text: Used
to type text.
Rectangle:
Used to draw a rectangle.
Circle: Used
to draw a circle.
Calculators
Toolbar

Dollar
Calculator: Used to find the dollar value between two points on the
chart.
Risk/Reward:
Used to find the difference between two points of the risk and reward
zone.
Time Interval Toolbar
Center Chart:
Takes existing price bars on all charts open and centers them in your
chart window.
Daily Chart:
Each price bar represents a day.
Long Term Daily:
Each price bar represents a day, but the chart includes all available
data.
Long Term
Weekly: Each chart price bar represents a week.
Long Term
Monthly: Each chart price bar represents a month.
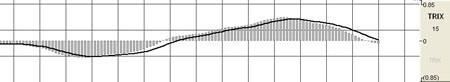
Indicator Window
This window
displays the Indicators.
Indicator Toolbar

Use this toolbar
to select the indicators you would like to be shown in the Indicator
window.
Scaling Toolbar
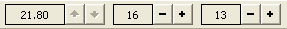
The first set of
controls scales the vertical height of the price bar. The middle set of
controls scales the number of price bars displayed per inch on the
chart. The last set of controls scales the days along the bottom of the
chart and the points displayed on the right side of the chart.
Back To Top
Control Panel
The control
panel is on the left side of your screen. It includes five tabs:
Commodities, Preferences, Key, Data, and
Notes.
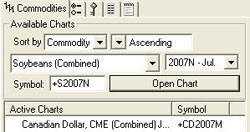 |
Commodities
This section of
the Control Panel gives you the ability to open a chart, add a chart to
your Chartbook, and to select between the charts that are open. See the
Chartbooks section for more details.
|
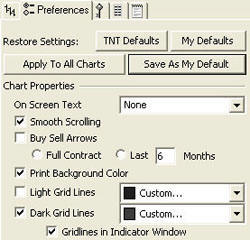 |
Preferences
The Preferences
Tab will help you customize how your chart looks and information on your
chart. It defaults to chart settings, but will also show the options for
customizing Technical Tools and Indicators. This is where you can change
colors, fonts, and line type for your chart and indicators.
|
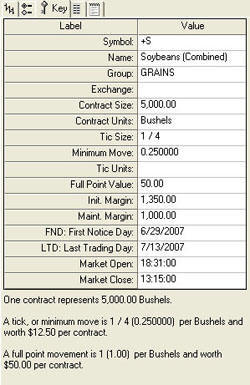 |
Key
This section
displays the key details and data from the contract displayed in the
Chart Window. (Terms are explained in depth in the Introduction to
Futures chapter.)
Symbol: Gecko Software’s symbol for the commodity.
Name: Name of the commodity.
Group: The group is a category for commodities.
Exchange: The exchange is where the commodity’s trades are
processed.
Contract Size: Number of units that one contract represents.
Contract Units: The unit of measurement.
Tic Size: The tic size is defined as the smallest increment the
quote of a contract will fluctuate.
Minimum Move: Tic size represented as a decimal value.
Tic Units: The unit of measure for quotes. This unit should be the
same as the unit that the Exchange uses.
Full Point Value: This value represents what a move in the ones
place is worth.
Init. Margin: The initial margin for your account.
Maint. Margin: The maintenance margin for your account.
First Notice Day (FND): Date that the contract will expire.
Last Trading Day (LTD): Last day to trade the open contract.
Market Open: The time that the market opens.
Market Close: The time that the market closes.
Options Expiration: The date that options will expire worthless or
be automatically exercised into futures orders.
Options Strike Interval: The value for the minimum spacing between
options, as listed by the Exchange.
Options Min. Move: The value of the minimum price fluctuation for
the options contract.
No. of strikes above/below: The value used to calculate strikes
above the highest high and below the lowest low in generated Black and
Scholes data.
|
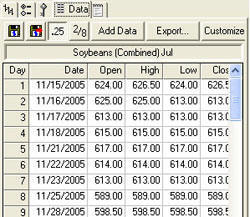 |
Data
The Data tab
will give you the historical data for each day a specific symbol had
traded. It will give you the open price, close price, highest price, and
lowest price on the day. It also shows the volume traded. Values for
indicators are added when the indicator is open.
The disk button
is used to save any changes you have made to the data, so that they are
available the next time you run the software. The disk button with the
red arrow on it is for undoing any data changes you have made but have
not saved. If you have already saved the incorrect value, this action
will not recall the original value.
You can select
to see all data in decimal or fractional format. Most commodities are
traded as decimal values and will be displayed as a decimal everywhere.
To customize the
Data tab, click on the Customize button and the Customize window will
open. In this window, you can select which data is displayed in the Data
tab. To change the data column display order, use the + or - keys on
your keyboard to move the selected item up or down in the list.
|
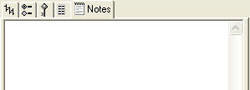 |
Notes
The Notes tab is
for your convenience to use as a note pad for your research and trading
strategy. A separate note pad is provided for each chart.
|
Back To Top
Data Downloads
Before you can look at any charts, you need to download the specific
commodities that you would like to view. The data download utility in
Track 'n Trade 5.0 is called FIDO and is simple to use. Easily control
the commodities that you download with the Commodity Chooser and keep
current with FIDO.
Commodity
Chooser
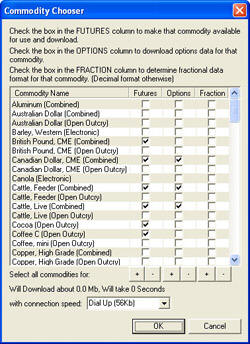 |
You can bring up
the commodity chooser window by selecting the Commodity Chooser button
from your Main toolbar, selecting Commodity Chooser... from your View
menu, or clicking Click to Choose a Commodity from the dropdown menu in
the Commodity tab of your Control panel.
In this window,
you can select which commodities you would like to download. The options
data is only available if you own the Options Plug-in and the Futures &
Options Data Subscription service.
Remember, you
can open this window often and download more commodities in the future.
If you would like to select or deselect all commodities, click on the +
or -
button
at the end of each column.
|
Note: Saved
Chartbooks containing charts from commodities that you have removed from
the Chart Window will not be affected by the Commodity Chooser. This
utility will not delete data from your hard drive. The Commodity Chooser
will only hide the commodity from the Commodity tab and from the daily
data downloads.
Back To Top
Commodity Symbols
Track ‘n Trade
5.0 will accept contracts typed in the following format:

|
Symbol |
Name |
Exchange |
Group |
|
+AD |
Australian Dollar
(c) |
CME / IMM |
currencies |
|
AD |
Australian Dollar
(o) |
CME / IMM |
currencies |
|
+BP |
British Pound,
CME (c) |
CME / IMM |
currencies |
|
BP |
British Pound,
CME (o) |
CME / IMM |
currencies |
|
+CD |
Canadian Dollar,
CME (c) |
CME / IMM |
currencies |
|
CD |
Canadian Dollar,
CME (o) |
CME / IMM |
currencies |
|
+EC |
Euro FX (c) |
CME / IMM |
currencies |
|
+JY |
Japanese Yen, CME
(c) |
CME / IMM |
currencies |
|
JY |
Japanese Yen, CME
(o) |
CME / IMM |
currencies |
|
+MP |
Mexican Peso (c) |
CME / IMM |
currencies |
|
MP |
Mexican Peso (o) |
CME / IMM |
currencies |
|
+SF |
Swiss Franc (c) |
CME / IMM |
currencies |
|
SF |
Swiss Franc (o) |
CME / IMM |
currencies |
|
RZ |
Euro/Swiss Franc
(e) |
NYBOT / FINEX |
currencies |
|
+DX |
U.S. Dollar (c) |
NYBOT / FINEX |
currencies |
|
DX |
U.S. Dollar (o) |
NYBOT / FINEX |
currencies |
|
AC |
Ethanol (o) |
CBOT |
energies |
|
+NG |
Gas, Natural (c) |
NYMEX |
energies |
|
+HU |
Gasoline,
Unleaded (c) |
NYMEX |
energies |
|
+HO |
Oil, Heating (c) |
NYMEX |
energies |
|
+CL |
Oil, Light Crude
(c) |
NYMEX |
energies |
|
+MB |
Municipal Note 10
yr (c) |
CBOT |
financials |
|
+US |
U.S. T-Bond 30 yr
(c) |
CBOT |
financials |
|
US |
U.S. T-Bond 30 yr
(o) |
CBOT |
financials |
|
+TY |
U.S. T-Note 10 yr
(c) |
CBOT |
financials |
|
TY |
U.S. T-Note 10 yr
(o) |
CBOT |
financials |
|
+TU |
U.S. T-Note 2 yr
(c) |
CBOT |
financials |
|
TU |
U.S. T-Note 2 yr
(o) |
CBOT |
financials |
|
+FV |
U.S. T-Note 5 yr
(c) |
CBOT |
financials |
|
FV |
U.S. T-Note 5 yr
(o) |
CBOT |
financials |
|
+ED |
Eurodollar (c) |
CME / IMM |
financials |
|
ED |
Eurodollar (o) |
CME / IMM |
financials |
|
+EM |
LIBOR, 1mo (c) |
CME / IMM |
financials |
|
EM |
LIBOR, 1mo (o) |
CME / IMM |
financials |
|
+C |
Corn (c) |
CBOT |
grains |
|
@YC |
Corn, mini (e) |
CBOT |
grains |
|
C |
Corn (o) |
CBOT |
grains |
|
+O |
Oats (c) |
CBOT |
grains |
|
O |
Oats (o) |
CBOT |
grains |
|
+RR |
Rice, Rough (c) |
CBOT |
grains |
|
RR |
Rice, Rough (o) |
CBOT |
grains |
|
+SM |
Soybean Meal (c) |
CBOT |
grains |
|
SM |
Soybean Meal (o) |
CBOT |
grains |
|
+BO |
Soybean Oil (c) |
CBOT |
grains |
|
BO |
Soybean Oil (o) |
CBOT |
grains |
|
+S |
Soybeans (c) |
CBOT |
grains |
|
@YK |
Soybeans, mini
(e) |
CBOT |
grains |
|
S |
Soybeans (o) |
CBOT |
grains |
|
+W |
Wheat, CBOT (c) |
CBOT |
grains |
|
@YW |
Wheat, CBOT, mini
(e) |
CBOT |
grains |
|
W |
Wheat, CBOT (o) |
CBOT |
grains |
|
KW |
Wheat, KCBT (o) |
KCBT |
grains |
|
MW |
Wheat, MGEX (o) |
MGEX |
grains |
|
@RS |
Canola |
WCE |
grains |
|
+DJ |
Dow J. IA (c) |
CBOT |
indices |
|
YM |
Dow J. IASM $5,
mini (e) |
CBOT |
indices |
|
+GI |
GSCI (c) |
CME / IOM |
indices |
|
+ND |
NASDAQ 100 (c) |
CME / IOM |
indices |
|
NQ |
NASDAQ 100, mini
(e) |
CME / IOM |
indices |
|
NK |
Nikkei 225 (o) |
CME / IOM |
indices |
|
+RL |
Russell 2000 (c) |
CME / IOM |
indices |
|
+SP |
S&P 500 (c) |
CME / IOM |
indices |
|
SP |
S&P 500 (o) |
CME / IOM |
indices |
|
ES |
S&P 500 Stock,
mini (e) |
CME / IOM |
indices |
|
+MD |
S&P MidCap 400
(c) |
CME / IOM |
indices |
|
MD |
S&P MidCap 400
(o) |
CME / IOM |
indices |
|
CR |
CRB (o) |
NYBOT / NYFE |
indices |
|
YX |
NYSE Composite,
regular old (o) |
NYBOT / NYFE |
indices |
|
+FC |
Cattle, Feeder
(c) |
CME |
meats |
|
+LC |
Cattle, Live (c) |
CME |
meats |
|
PB |
Hogs, Frozen
Bellies(o) |
CME |
meats |
|
+LH |
Hogs, Lean (c) |
CME |
meats |
|
DA |
Milk, fluid class
III (o) |
CME |
meats |
|
@YG |
Gold, mini (e) |
CBOT |
metals |
|
@YI |
Silver, mini (e) |
CBOT |
metals |
|
+HG |
Copper, High
Grade (c) |
NYMEX / COMEX |
metals |
|
+GC |
Gold (c) |
NYMEX / COMEX |
metals |
|
+PA |
Palladium (c) |
NYMEX / COMEX |
metals |
|
+PL |
Platinum (c) |
NYMEX / COMEX |
metals |
|
+SI |
Silver (c) |
NYMEX / COMEX |
metals |
|
LB |
Lumber, random
length (o) |
CME |
softs |
|
CC |
Cocoa (c) |
NYBOT / CSCE |
softs |
|
KC |
Coffee C (o) |
NYBOT / CSCE |
softs |
|
SB |
Sugar #11 (o) |
NYBOT / CSCE |
softs |
|
CT |
Cotton #2 (o) |
NYBOT / NYCE |
softs |
|
OJ |
Orange Juice, FC
(o) |
NYBOT/NYCE |
softs |
Legend for the Commodity Symbols
+ Combined
Contract
(c) Combined
Data
(o) Open Outcry
Session
(e) Electronic
Session
Commodity Month Symbols
| F |
January |
N |
July |
| G |
February |
Q |
August |
| H |
March |
U |
September |
| J |
April |
V |
October |
| K |
May |
X |
November |
| M |
June |
Z |
December |
Back To Top
Data Update
The Data Update
button is located next to the Commodity Chooser button in your Main
toolbar. Click on this button to open the data download program, FIDO.
Before opening
FIDO, Track ‘n Trade 5.0 will check for product updates. If an update is
available you will be notified and given a window to choose "Yes" or
"No" on the update. It is recommended that you install each update as it
becomes available. After you are finished with the program update, you
will be returned to FIDO.
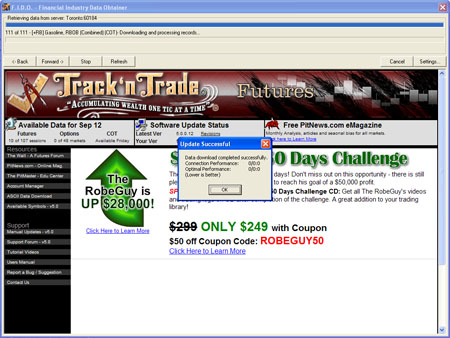
If the data
update does not begin automatically, click on "Begin" to start the data
update. A window will appear when the data update is completed. Click on
OK and exit out of the FIDO window to return to Track ‘n Trade 5.0.
Note: Do not
press the power or reset buttons on your computer if FIDO freezes and
you are unable to close the window. If this happens, press the buttons
Ctrl, Alt, Delete at the same time to open the "Windows Task Manager"
(only press them ONCE). Select FIDO.exe from the list and click on the
"End Task" button. This will close FIDO and allow you to restart Track
‘n Trade 5.0.
Firewalls
A firewall is a
piece of software or hardware that protects your computer from being
accessed by other people on the Internet. A firewall only allows basic
types of Internet and network communications. But it keeps you safe and
is important to have.
In order to
speed up the downloading process, Track ‘n Trade 5.0’s FIDO does not use
conventional means to download data. Because of this, Track ‘n Trade 5.0
may encounter problems downloading through the firewall. It may appear
that the downloader is idle for a long period of time and then it will
display an error stating it could not find the server. This is because
the firewall does not allow the server to send the new data to your
computer.
Track ‘n Trade
5.0 has a new feature to allow for both standard and non-standard
methods for downloading data. The standard method uses Port 80 which is
accepted by most firewalls as regular traffic, but this method is
slower. The non-standard method uses Port 60184 and will need to have an
exception made in order for this method to work with a firewall; this
method is much faster than Port 80 in downloading data.
Configuring
Track ‘n Trade 5.0 for Firewalls:
1. Click on the
Data Update button from the Main toolbar to start FIDO.
2. Click on the
button located in the far right called "Options."
3. If you are
working with a firewall, select "Port 80" and then click the "OK"
button.
4. Close FIDO,
then restart by clicking on the "Data Updates" button.
Back To Top
Chartbooks
Just like a
novel is made up of many single pages, a chartbook contains many
individual charts. Each chartbook can contain several charts, each
individual chart becoming the "pages" of your chartbook. Every time you
open Track 'n Trade 5.0, a blank chartbook named Untitled Book will
open. You can either continue with this new chartbook or open a
chartbook that has already been saved.
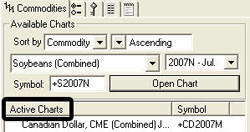 Each
chart that you open and view from the Commodities tab is listed below in
the Active Charts list found on the left side of your screen. This list
is your "Table of Contents" for your chartbook. Charts are listed in
alphabetical order in this window. To switch between charts simply
double-click on the different charts listed. Each
chart that you open and view from the Commodities tab is listed below in
the Active Charts list found on the left side of your screen. This list
is your "Table of Contents" for your chartbook. Charts are listed in
alphabetical order in this window. To switch between charts simply
double-click on the different charts listed.
Creating a
New Chartbook
Track ‘n Trade
5.0 will automatically open a new chartbook whenever you open the
program. This new chartbook needs "pages" or charts added to it. You can
add pages to your chartbook by opening charts in the commodity tab. If
you know the symbol for the chart you are looking for, you can type it
into the entry box next to Symbol and press enter. A complete list of
commodity symbols and commodity month symbols can be found in the Data
Download section. If you do not know the symbol of the market you want
to see, find your chart by choosing the market, month and year:
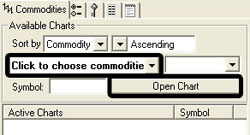
1. Choose
your commodity from the dropdown menu
2. Choose
the month and year from the dropdown menu to the right
3. Click on
the "Open Chart" button below
Sorting the
Commodity List
Notice that you
have sorting options above the Choose a Commodity drop down menu. You
can sort commodities by Group or Exchange, and you can display them in
Ascending or Descending order.
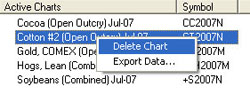
Removing Charts
in your Chartbook
Now that you
have charts in your chartbook, you have the ability to add and remove
charts as you wish before you save it as a chartbook. Right click on the
chart you would like to remove and select "Delete Chart" from the
dropdown menu. A Confirm Chart Deletion window will appear on your
screen. Click OK.
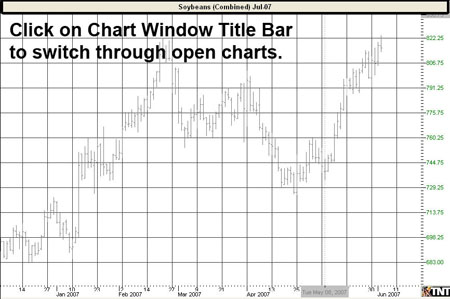
Switching
Between Charts in your Chartbook
When you have
several charts open in your Active Charts window, there are several ways
for you to switch back and forth between them:
-
Double-click the chart you would like to view in the Active
Charts list
-
Click on
the chart window Title Bar
-
Click on
the current chart and press the Tab key on your keyboard
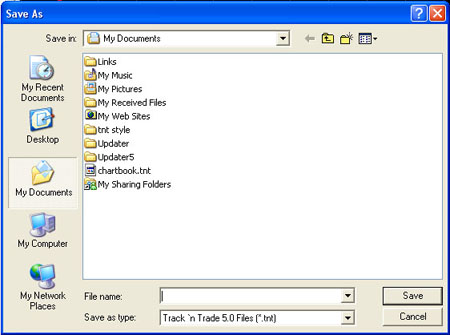
Saving and
Closing a Chartbook
When you are
content with how your Active Chart list is setup, you can save it as a
chartbook to open later. Click on the File menu and select "Save" or
click the Save button on your Toolbar. The Save As window will open. It
is recommended that you rename your chartbook to avoid accidentally
overwriting the file next time a chartbook is saved.
To save over or
replace a chartbook that has already been saved, select "Save As" from
the File menu. Type in a new name or select the chartbook you want to
save over.
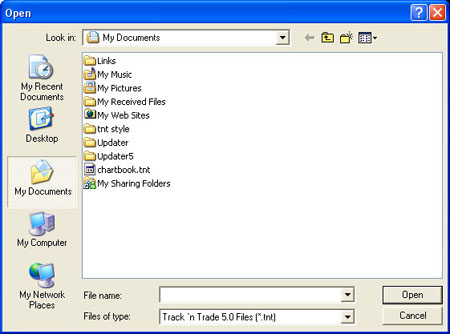
Note that the
default folder is My Documents. If you choose to save your chartbook
into a different folder, remember that this is the location in which
your chartbook will be saved. Some Track ‘n Trade users have named Books
according to Groups, Commodities, or Exchanges based on the charts that
they are saving in the Book. As you become familiar with Track ‘n Trade
5.0, you will be able to develop a system of your own.
Opening an
Existing Chartbook

To open an
existing chartbook, you can click on the File menu and select "Open," or
click on the Open button on your Main toolbar. The Open window will
appear.
In the Open
window, select the file you would like to open and click on the Open
button.
You will also
find that a recently saved chartbook will be in the bookmark section at
the end of the File menu.
Saving Charts as
an Image
Many Track ‘n
Trade 5.0 users include Chartbooks and images of their charts in emails,
websites, presentations, etc. To save a current chart as it appears on
your screen as an image, click on the Screen Capture button in your Main
toolbar.
The Save Chart
Image window will open. You may specify the file name, location, and
file type (the standard web file types are .gif or .jpg). Once the image
is saved, you are ready to email it or import it into a document.
Printing a Chart
To print a chart
in Track ‘n Trade 5.0, click on the File menu and select "Print." The
Print screen will open for your default printer. You can also print a
chart by clicking on the Print button on your Main toolbar.
The printed
chart will always have the Indicator Window printed at the bottom of the
chart. The size of the chart will depend on the size that it is when you
press the Print button. To change from Portrait to Landscape, click on
"Print Setup" from the File Menu. Selecting the Landscape button will
print a full-page chart, while Portrait will print a half-page chart.
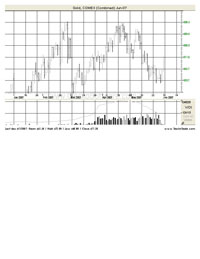
For an idea of
what the chart will look like printed, select Print Preview from the
File menu or your Main toolbar to view the output before printing the
chart. The last day’s open, high, low, and close will also be printed on
the chart.
Back To Top
Charting
Preferences
You can specify
how your chart looks by using the Preferences tab in your Control Panel
or by right-clicking in your chart window and using selections from the
dropdown menu.
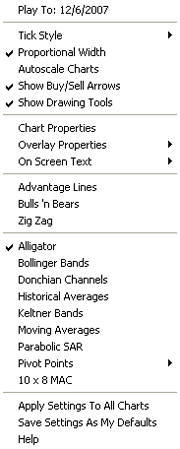
Right-click Menu
When you
highlight Tick Style, a menu will appear to the right of the
dropdown window. From here, you can select which style of ticks you
would like to appear on your chart.
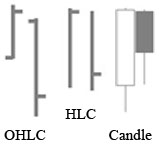
OHLC will
show the open, high, low, and close tick marks for the day. HLC
will be the same, without the initial open tick. Close will take
the closing prices for each day and turn your chart into a line graph.
Close EX stands for Close Extended. It will look like Close with
the close price as an extended horizontal line. Candle will show
your price pars as candlesticks. (Candlesticks are explained in the
Candlesticks chapter at the end of the manual.)
 Selecting
Proportional Width will make your price bar width proportional to
the scale of your chart. Selecting
Proportional Width will make your price bar width proportional to
the scale of your chart.
Autoscale Charts
forces the chart to scale the price bars displayed in the chart window
based on the highest and lowest point available in this set of price
bars. It will rescale the chart as you go forward or backward in time.
(If you would like to center your chart without turning on the Autoscale
feature, click on the Center button in your Time Interval toolbar.)
Select Show
Buy/Sell Arrows to view Buy and Sell arrows on your chart. If this
option is not selected, buy and sell arrows will not appear on your
chart even if you have an indicator selected that has buy and sell
signals.
Select Show
Drawing Tools to view all the drawings you've made on your chart.
Deselecting this option will not delete the drawings. Once you re-select
this option, your drawings will reappear on your chart.
If you select
Chart Properties, the chart preferences will open in your control
panel.
Preferences Tab
The Preferences
tab is located in the Control Panel. Chart preferences appear in the
window by default. Any time you don’t see chart preferences when your
preferences tab is open, click on your chart in the chart window and the
chart preferences will appear.

In this tab, you
can customize every detail of how your chart looks. You can specify
colors and sizes of all the features on your chart.
Restore
Settings: TNT Default will change your settings back to the original
software settings. My Default will change current settings to your
personalized default settings. Apply To All Charts will apply your
selected settings on all open charts. Save As My Default will save your
current personal settings.
Themes
Track ‘n Trade
5.0 gives you the ability to save your personal settings as a theme.
With different themes, you can apply many pre-set characteristics
quickly to a chart.
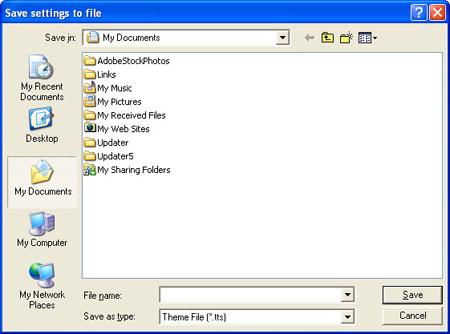
When you have
your settings how you like them, select Save Themes from your
View menu. The Save settings to file window will appear. Choose where
you would like your themes to be saved, name your theme, and click on
"Save."
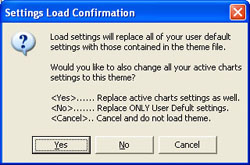 Select Load
Themes from your View menu to apply a saved theme. The Settings Load
Confirmation window will appear. Click Yes if you want to replace all
user default settings with your theme and have your theme apply to all
active charts. Click No if you only want to replace your user default
settings with your theme, but don’t want your theme to apply to your
active charts. Clicking Cancel will exit the window and no theme will be
applied. Select Load
Themes from your View menu to apply a saved theme. The Settings Load
Confirmation window will appear. Click Yes if you want to replace all
user default settings with your theme and have your theme apply to all
active charts. Click No if you only want to replace your user default
settings with your theme, but don’t want your theme to apply to your
active charts. Clicking Cancel will exit the window and no theme will be
applied.
The Open window
will appear if you select Yes or No. Find your saved theme and click
"Open."
Back To Top
|