|
|
Long Term Charts
Generating and Customizing Long Term Charts
Introduction
Track ‘n Trade
5.0 generates weekly and monthly long-term charts from more than 30
years of historical data. Open the chart you would like to view as a
long term chart. The chart is automatically set to open as a daily chart
for the month you specified. Click on the appropriate button to the
right of the chart window to view a Daily, Weekly, or Monthly Long Term
chart.
 |
Center Chart:
Centers the chart in your chart window how it is right now.
Clicking on this button will not autoscale your chart if you
play it forward or backward. |
|
Daily Chart: Sets your current chart so each price interval
represents one day. |
| Long Term Daily:
Sets your current chart as daily, but includes all available
data. |
| Long
Term Weekly: Sets each price interval as one week. |
| Long
Term Monthly: Sets each price interval as one month. |
Comparison of Chart Ticks
| Chart |
Price
Interval Represents |
Open |
High |
Low |
Close |
| Daily |
One Day |
Day's Open |
Day's High |
Day's Low |
Day's Close |
| Weekly |
One Week |
1st Day's Open |
High for the Week |
Low for the Week |
Last Day's Close |
| Monthly |
One Month |
1st Day's Open |
High for the Month |
Low for the Month |
Last Day's Close |
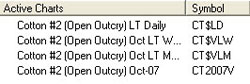
When you click
on the Daily Long Term button, the new chart will open in the chart
window. The chart will also be listed as a new chart in your control
panel under Active Charts. The symbol will be generated by using the
commodity symbol followed by a dollar sign and LD for Long term Daily
(Example: Cotton #2 would be CT$LD). Weekly Long Term and Monthly Long
Term symbols will be generated the same way with commodity symbol, a
dollar sign, and the month letter followed by LW for weekly or LM for
monthly (Example: Cotton #2 for Long Term Monthly would look like CT$VLM).
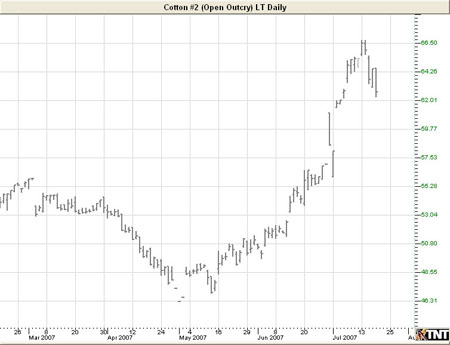
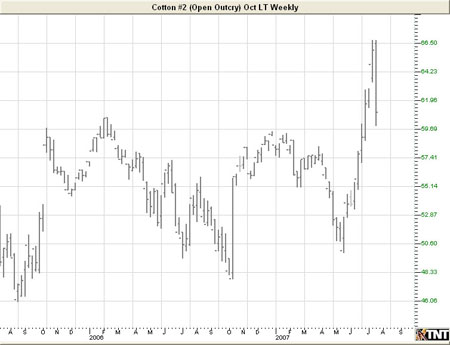
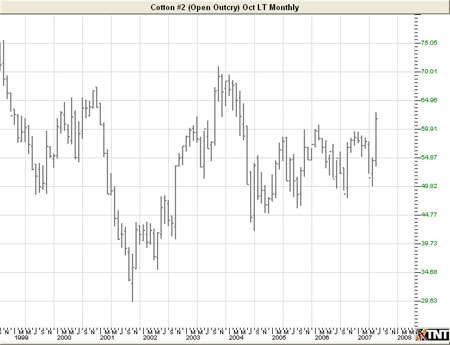
Examples of Long Term Charts in the Chart
Window
Creating Long Term Charts
Because
commodity contracts overlap over each other, Track ‘n Trade 5.0 creates
Long Term charts by placing together the data from the front month
contracts. This method only shows the data for the section of the
contract that is actively being traded and excludes the excess, giving
the contract higher volume and open interest.
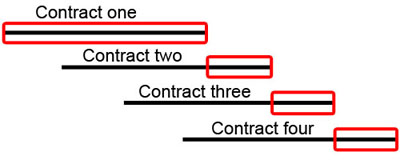
The boxes
represent the portion of the contract that Track ‘n Trade 5.0 uses to
create the long term chart.
Back To Top
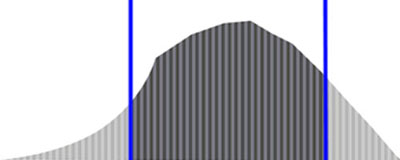
Long Term Chart Options
Another way to
create a long-term chart is to take only the "fat" portion of each front
month contract and paste them together. With this method, you are
cutting off both the beginning of the chart, where there is typically
less volume and open interest, and the end of the chart, where it is
"cooling down" from traders who are transferring their orders to the
next month’s contract.
Contracts tend
to have more activity during the middle of the contract and less toward
the end. Track ‘n Trade 5.0 can cut out the middle of each contract and
paste the contracts together as a long term chart.
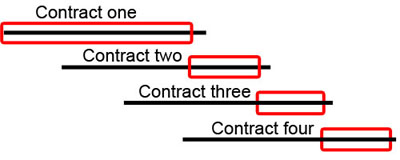
Using options
available in Track ‘n Trade 5.0, traders are able to specify the number
of days at the end of a contract that they would like excluded from a
long term chart.
Back To Top
Long Term Settings
You can find the
settings for Long Term charts in the View menu from the top of your
screen. When you click on Long Term Settings the Dialog window
will appear.
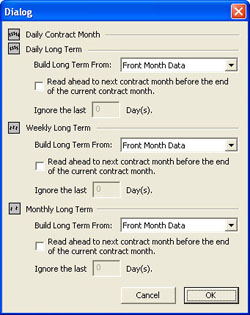 |
The
window is divided into Daily, Weekly, and Monthly options. Modify the
Long Term Settings for the type of chart you want to use.
Select from the
dropdown menu if you would like to build long term charts from front
month data or contract month data. Selecting Front Month Data
will use data from one contract month to the next in chronological order
(Jan 2006, Mar 2006, May 2006). Selecting Contract Month Data
will use data from a contract month from each successive year (Jan 2003,
Jan 2004, Jan 2005). Charts opened with the Contract Month Data setting
will have the letter month as part of the chart symbol in the Active
Charts window.
|
To cut off the end of the
contract used in your long term chart, click on the empty check box in
front of "Read ahead to next contract month before the end of the
current contract month." Specify the number of days in the box that you
would like to exclude. This option is best used for historical data. If
you are looking at a long term chart that includes current data and you
set this option to exclude 10 days, the chart will roll over to the next
contract 10 days early.
Back To Top
|