|
Notation Tools
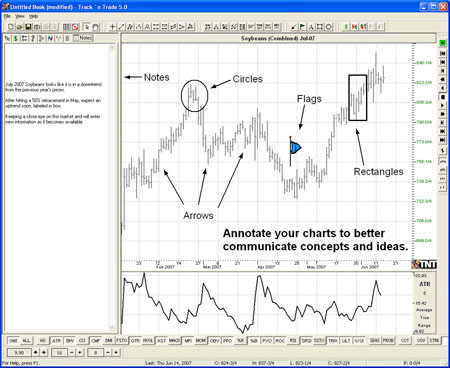
Personalizing Your Charts with Notation Tools
Introduction
In Track ‘n
Trade 5.0, you have a variety of tools available to you to help
personalize, notate, and analyze your futures charts. You can type text, make
drawings, import flags, and keep notes on each chart. The Notation
tools, as well as the Notes tab in the Control Panel, enable you to
record and remember what you learn from others’ tips and tricks. In this
section you will learn how to use these features.
Example of Personalizing a Chart
Notes Window
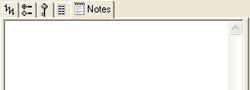
The Notes window
is the last tab in the Control Panel, after the Data tab. The Notes tab
is for you to keep notes on the charts that are saved within your
chartbook. Each chart has a new Notes section available to keep notes
for that particular chart.
Back To Top
Arrow Tool
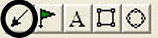
The Arrow tool
is located in the Notation toolbar. This tool enables you to draw arrows
to help point out areas of interest on your chart. Position the mouse
pointer where you want to place the point of the arrow and click the
mouse button. Drag the mouse pointer to the location you would like to
end the arrow. Release the mouse button to place.
Resizing the
Arrow
Select the arrow
drawing by clicking on it. The arrow is selected when boxes appear at
the ends of the line. Click on one of the boxes and drag it to the
desired length. Release the mouse button to place the end point of the
line.
Moving the Arrow
Select the arrow
drawing by clicking on it. Click on the arrow, not an end box, and drag
it to the new location. Release the mouse button to place.
Deleting the
Arrow
Select the arrow
drawing by clicking on it. Press the Del (Delete) key on your keyboard.
You can also right-click the drawing and select "Delete" from the
dropdown menu.
Preferences
Select the
drawing by clicking on it. The properties will appear in the preferences
section of your control panel. Or, right-click on the drawing and select
properties from the dropdown menu.
Restore
Settings: TNT Default will change your settings back to the original
software settings. My Default will change current settings to your
personalized default settings. Apply To All Charts will apply your
selected settings on all open charts. Save As My Default will save your
current personal settings.
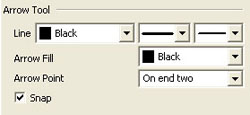 |
Arrow Fill:
Select what color you want the point of your arrow to be. You can also
choose which end you want the Arrow Point or if you want it on
both ends.
Select Snap
to have your lines snap to price bars when moved.
|
Back To Top
Flag Tool
The Flag tool
enables you to place a flag or a graphic on your chart. There is a basic
set of flags available to choose from or you can import custom flags.
Select the Flag tool from the Notation toolbar. Click on the chart where
you would like the top of the Flag. The default flag will be placed in
this location.
Resizing the
Flag
Select the flag
drawing by clicking on it. The flag is selected when boxes appear at the
corners of the graphic. Click on one of the boxes and drag it to the
desired length. Release the mouse button to place.
Moving the Flag
Select the flag
drawing by clicking on it. Click on the flag, not an end box, and drag
it to the new location. Release the mouse button to place.
 |
Deleting the
Flag
Select the flag
drawing by clicking on it. Press the Del (Delete) key on your keyboard.
You can also right-click the line drawing and select "Delete" from the
dropdown menu.
Preferences
Select the flag
drawing by clicking on it. The properties will appear in the preferences
section of your control panel. Or, right-click on the drawing and select
properties from the dropdown menu.
Restore
Settings: TNT Default will change your settings back to the original
software settings. My Default will change current settings to your
personalized default settings. Apply To All Charts will apply your
selected settings on all open charts. Save As My Default will save your
current personal settings.
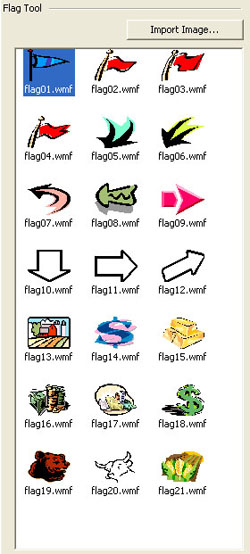
Flag Tool:
You can select a different flag and change or import a custom flag
(Importable formats: . wmf, .jpeg, and .gif.
|
Back To Top
Text Tool
The Text tool
enables you to type text on the Chart. Select the Text toll in the
Notation toolbar. Click on the chart where you would like to place the
upper left corner of the text box. Drag the text box to the lower right
corner of your desired text box. Release the mouse button to place.
Once the box is
drawn, the Text Tool Options window will open. Enter the text, set the
font, size, position, color, and style of the text. Select a border and
background if you would like. Click "OK" when finished and text will be
place on your chart.
Moving the Text
Select the text
box by clicking on it. Continue holding down the mouse button to drag
text to the new location. Release mouse button to place.
Deleting the
Text
Select the text
box by clicking on it. Press the Del (Delete) key on your keyboard. You
can also right-click the text box and select "Delete" from the dropdown
menu.
Preferences
Select the text
box by clicking on it. The properties will appear in the preferences
section of your control panel. Or, right-click on the drawing and select
properties from the dropdown menu.
Restore
Settings: TNT Default will change your settings back to the original
software settings. My Default will change current settings to your
personalized default settings. Apply To All Charts will apply your
selected settings on all open charts. Save As My Default will save your
current personal settings.
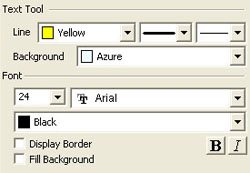 |
Text
Tool: You can choose the color, line style, and line thickness of
your text frame. You can also determine the color of your background.
(To make your background or line transparent, deselect Display Border
or Fill Background at the bottom of your preferences.)
Font: Select
the font, size, and color of the text.
|
Back To Top
Rectangle Tool
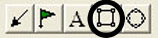
The Box tool
enables you to draw square or rectangle shaped drawings on the chart.
Select the Box tool in the Notation toolbar. Click where you would like
to place the top-left corner of the box, hold down the mouse button and
drag to the location of the bottom-right corner of the box. Release the
mouse button to place.
Resizing the
Rectangle
Select the
rectangle drawing by clicking on it. The drawing is selected when boxes
appear at the corners of the graphic. Click on one of the boxes and drag
it to the desired length. Release the mouse button to place.
Moving the
Rectangle
Select the
rectangle drawing by clicking on it. Click on the drawing, not an end
box, and drag it to the new location. Release the mouse button to place.
Deleting the
Rectangle
Select the
rectangle drawing by clicking on it. Press the Del (Delete) key on your
keyboard. You can also right-click the drawing and select "Delete"
from the dropdown menu.
Preferences
Select the
drawing by clicking on it. The properties will appear in the preferences
section of your control panel. Or, right-click on the drawing and select
properties from the dropdown menu.
Restore
Settings: TNT Default will change your settings back to the original
software settings. My Default will change current settings to your
personalized default settings. Apply To All Charts will apply your
selected settings on all open charts. Save As My Default will save your
current personal settings.
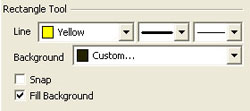 |
Rectangle
Tool: You can choose the color, line style, and line thickness of
your box frame. You can also determine the color of your background. (To
make your background transparent, deselect Fill Background at the
bottom of your preferences.)
Select Snap
to have your lines snap to price bars when moved.
|
Back To Top
Circle Tool
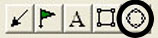
The Circle tool
enables you to draw circle shaped drawings on the chart. Select the
Circle tool in the Notation toolbar. Click on the chart where you would
like the circle to start. Continue holding down the mouse button and
drag the tool until it has formed a circle. Release the mouse button to
place.
Resizing the
Circle
Select the
circle drawing by clicking on it. The circle is selected when boxes
appear at the corners of the graphic. Click on one of the boxes and drag
it to the desired length. Release the mouse button to place.
Moving the
Circle
Select the
circle drawing by clicking on it. Click on the box, not an end box, and
drag it to the new location. Release the mouse button to place.
Deleting the
Circle
Select the
circle drawing by clicking on it. Press the Del (Delete) key on your
keyboard. You can also right-click the drawing and select "Delete"
from the dropdown menu.
Preferences
Select the
circle drawing by clicking on it. The properties will appear in the
preferences section of your control panel. Or, right-click on the
drawing and select properties from the dropdown menu.
Restore
Settings: TNT Default will change your settings back to the original
software settings. My Default will change current settings to your
personalized default settings. Apply To All Charts will apply your
selected settings on all open charts. Save As My Default will save your
current personal settings.
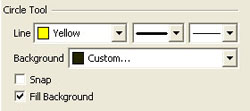 |
Circle
Tool: You can choose the color, line style, and line thickness of
your circle outline. You can also determine the color of the background.
(To make your background transparent, deselect Fill Background at
the bottom of your preferences.)
Select Snap
to have your lines snap to price bars when moved.
|
Back To Top
|