|
Options Plug-in
Implementing Options Strategies
Introduction
The Track ‘n
Trade 5.0 Options Plug-in gives you the ability to place put/call orders
on the futures chart, calculate profit/loss on an option or on an option
strategy, calculate the "Greeks," and use two indicators that display
the option as under or overvalued.
Requirements
In order to
place options orders or use any of the options tools, you will also need
to own the Accounting & Simulator Plug-in. See the Accounting &
Simulator Plug-in chapter for more information and call us at
1-800-862-7193 to reach the sales department and order the plug-in
today!
Placing an
Options Put/Call Order
Option orders
can be placed by selecting the Options Call or Options Put order tools
in your Accounting Toolbar. Click on your chart and hold down the mouse
while you drag the order tool along the futures chart. Release the mouse
button when you have reached your desired position. The Options Order
window will open.
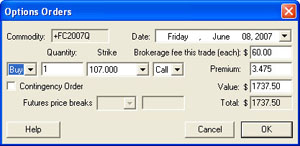 |
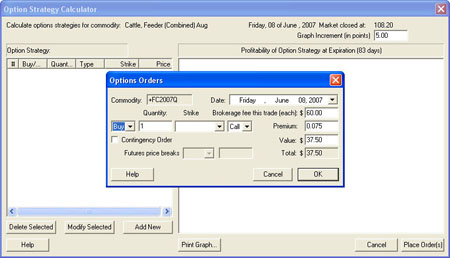
Commodity/Date: Type in the commodity symbol and date for the chart.
The values are pre-filled when placing on chart.
Buy or Sell:
Select from the dropdown menu.
|
Quantity:
Enter the value you would like to use. The default is set at 1.
Strike Price:
Enter the value of the strike price. The value is pre-filled when
placing on chart.
Call or Put:
Select the order type from the dropdown menu. The value is pre-filled
with type of option order tool chosen.
Brokerage Fee:
Enter the value you would like to use. The default is set at $0.00
Premium:
Enter the point value for the strike price.
Value:
Enter the dollar amount of the Premium.
Contingency
Order: Check this box if you want the option order executed based on
a specific futures price.
Note: Once
you place an option order on your chart window, it will be filled on
yesterday’s close.
Preferences
Options preferences will open in your control panel when you place a put
or call. (Once you click on the chart, the Preference tab will go back
to chart settings.)
Restore Settings: TNT Default will change your settings back to the
original software settings. My Default will change current settings to
your personalized default settings. Apply To All Charts will apply your
selected settings on all open charts. Save As My Default will save your
current personal settings.
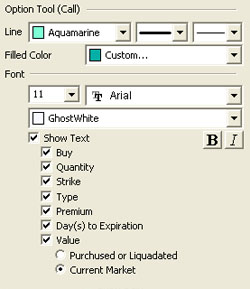 |
Line: You can choose the color, line style, and line
thickness of your line. You can also specify the Filled Color
for when the option is filled.
Font: Select the font, size, and color of the text.
Select Show Text to hide or show your text on the chart.
Select or deselect Buy, Quantity, Strike,
Type, Premium, Day(s) to Expiration, and
Value to show or hide their corresponding value on your
chart.
|
Back To Top
Options Tab
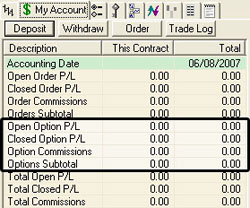 When
you purchase the Options Plug-in, An Options section will be added to
your My Account tab in the Control Panel. The options orders that are
placed are also listed in the My Account tab. When
you purchase the Options Plug-in, An Options section will be added to
your My Account tab in the Control Panel. The options orders that are
placed are also listed in the My Account tab.
The Options tab
is located in the Control Panel after the Spreads tab. It looks like a
green up arrow and purple down arrow. When you first click on the
Options tab, it defaults to the "Date View" which contains the options
data
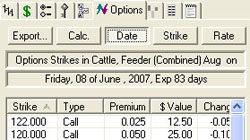 available. available.
Open the
corresponding futures chart in the Commodity tab for the options pricing
that you are interested in viewing. You will notice that the Options tab
is now populated with values.

Strike:
The price at which the futures contract underlying an option is to be
bought or sold upon exercise.
Type: Type
of options order, Put or Call.
Premium:
Value (in points) to purchase the option.
$Value:
Dollar amount for the premium value.
Change:
The difference between yesterday’s and today’s strike.
Diff:
Dollar amount for the Change.
IVol:
Implied Volatility of the underlying futures contract.
Delta:
Measures how much the options price changes when the underlying futures
contract changes by one point.
Gamma:
Measures how much the delta changes when the underlying futures contract
changes by one point.
Theta:
Measures time decay of an option.
Vega:
Measures how a change in volatility affects the price of an option when
all other factors remain the same.
Rho:
Measures how a change in a short-term risk free interest rate affects
the price of an option.
Note: If you
do not have a contract open, the only item available in Options
Tab is the Interest Rate History.
Back To Top
Strike and Rate History
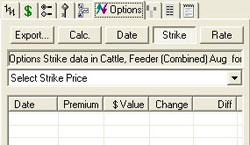 The
Options Tab defaults to the Date View, which shows a list of all strike
prices available for that day. To view the history for a particular
strike price, click on the Strike button and select the specific
Put/Call Strike price from the dropdown menu. Once this value is
selected, the history for that price is generated. The
Options Tab defaults to the Date View, which shows a list of all strike
prices available for that day. To view the history for a particular
strike price, click on the Strike button and select the specific
Put/Call Strike price from the dropdown menu. Once this value is
selected, the history for that price is generated.
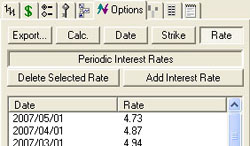 To
view the historical interest rate data, click on the Rate button to the
right of the Strike button. The rate displayed is the average monthly
interest rate of the three month Treasury Bill secondary market rates.
Interest rates are used by the Black & Scholes options formulas to
determine the theoretical options price (more information on Black &
Scholes at the end of this chapter). To
view the historical interest rate data, click on the Rate button to the
right of the Strike button. The rate displayed is the average monthly
interest rate of the three month Treasury Bill secondary market rates.
Interest rates are used by the Black & Scholes options formulas to
determine the theoretical options price (more information on Black &
Scholes at the end of this chapter).
Note:
Because most futures contracts expire in under a year, we have not
noticed the interest rate to make a large difference on the dollar value
of an options price.
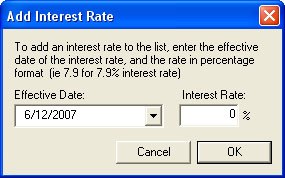
Adding an Interest Rate
Interest rates
are updated by Gecko Software, Inc., on a regular basis. If you want to
add a new interest rate manually, click on the Add Interest Rate button
and the Add Interest Rate window will open. Choose the date for the
effective date dropdown menu and type the new interest rate in the input
box. Click OK to save or Cancel to exit from the window.
Deleting an
Existing Interest Rate
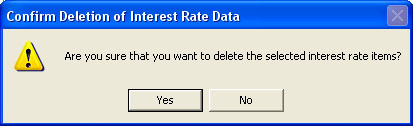
To delete an
existing interest rate, select the interest rate that you would like to
delete by clicking on it. Click the Delete Interest Rate button and a
window will open asking you to verify that you would like to delete this
interest rate. Click YES to continue or NO to cancel.
Back To Top
OS Calculator
The OS
Calculator determines profit/loss on an option or option strategy. Click
on the Calc button to open. Click on the Add New button to add an option
order to the calculator and the Option Order window will open. Specify
the details of the options order and click OK to add the order to the
calculator.
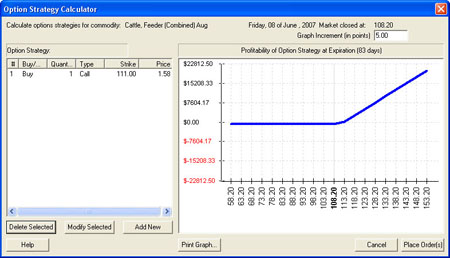
The options
order details have now been added to your option strategy list on the
left side of the OS Calculator and the Profitability Graph of the Option
Expiration is available on the right side.
Modify/Delete
Orders
Select the order
you would like to change and click the Modify Selected button. To delete
orders from the calculator, click on the order and click the Delete
button.
Place Orders
To place the
orders from the calculator on the underlying futures chart, click the
Place Order(s) button or Cancel to exit the Options Strategy Calculator.
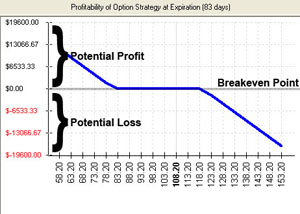
The
Profitability of Option Strategy at Expiration
The OS
Calculator enables you to enter an Option Strategy to see the potential
profit/loss of that strategy/order.
Back To Top
OSV & STRK Indicators
The Options
Plug-in contains two indicators used to determine if an option is over
or under valued. The indicators available are Options Strike Value and
Strike Price. Select to view these indicators from one of these
locations.
The Indicator
Toolbar
The OSV and STRK
buttons have been added to your Indicator Toolbar at the bottom of your
screen. Click on the indicator you would like to view. You can also
change the put/call strike that the indicator is based on from the
dropdown menu next to the buttons.
Right-Click Chart
Right-click the
Indicator Window to view the dropdown menu. All your indicators are
listed in alphabetical order. Highlight and click the indicator you
would like to view. Selected indicators will have a checkmark next to
their name.
Back To Top
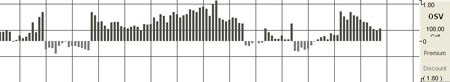
Options Strike
Value (OSV)
This indicator
displays the theoretical option values versus the actual option price
value for a specific put/call strike price as a histogram. The positive
values represent over-valued and the negative values represent
under-valued options.
Example of the
OSV in the Indicator Window
Preferences
Open the
Preference tab from the Control Panel on the left of your screen. Click
on the Indicator Information Display to scroll through the different
Indicators you have open until you get to OSV. The preferences will
appear in the Control Panel. (Once you click on the chart, the
Preference tab will go back to chart settings.)
Restore
Settings: TNT Default will change your settings back to the original
software settings. My Default will change current settings to your
personalized default settings. Apply To All Charts will apply your
selected settings on all open charts. Save As My Default will save your
current personal settings.
 |
Options
Strike Value: Choose the color of your Over Valued and
Under Valued lines.
Strike Price:
Enter the price you would like to use.
Thresholds:
View up to four thresholds at a value that you type in and a color that
you choose.
|
Back To Top
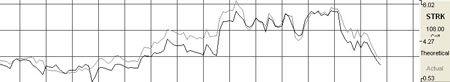
Strike Price (STRK)
This indicator
also displays the theoretical option values versus the actual option
price value. However; this indicator displays them as two lines. By
looking at these two lines you are able to determine if the option price
is under or over priced.
Example of the
STRK in the Indicator Window
Preferences
Open the
Preference tab from the Control Panel on the left of your screen. Click
on the Indicator Information Display to scroll through the different
Indicators you have open until you get to STRK. The preferences will
appear in the Control Panel. (Once you click on the chart, the
Preference tab will go back to chart settings.)
Restore
Settings: TNT Default will change your settings back to the original
software settings. My Default will change current settings to your
personalized default settings. Apply To All Charts will apply your
selected settings on all open charts. Save As My Default will save your
current personal settings.
 |
Strike
Price: Choose the color, line style, and line thickness of your
Black and Scholes Theoretical and Reported Market Value
lines.
Strike Price:
Enter the price you would like to use.
Thresholds:
View up to four thresholds at a value that you type in and a color that
you choose.
|
Back To Top
Black and Scholes Calculations
Modern option
pricing techniques are often considered among the most mathematically
complex of all applied areas of finance. Financial analysis are now able
to calculate, with alarming accuracy, the fair market value of a
financial option. Gecko Software, Inc., employs the calculations
developed in 1973 by Fischer Black and Myron Scholes. This model is
known as the "Black and Scholes Options Pricing Model."
The Black and
Scholes pricing model uses a sophisticated mathematical formula to
calculate the theoretical value of an option using variables such as
market open, high, low, and close values, interest rates, volatility
calculations, and other such information to give us these all important
values.
Track ‘n Trade
5.0 is, first and foremost, a trading simulation software application
where you are able to go back in time nearly 30 years and practice
trading forward, one day at a time. In essence, we are giving a trader
30 years of simulated trading experience in a matter of hours, days, or
possibly weeks. We allow the trader to use actual historical futures
market OHLC (Open, High, Low, Close) data to simulate trading the
commodities market. In that regard, it would be nearly impossible for us
to assemble a complete set of 30 years of historical options data which
would allow users this same historical data training privilege. Also,
due to the massive amount of data this would require, and given today’s
limits of computer speeds, hard drives, and storage capacity, trying to
provide this type of data history to a typical user would simply put
this capability out of reach for the common trader.
This is where
the Black and Scholes pricing model comes into play. Our skilled
computer scientists at Gecko Software have created a way for us to use
the data generated by the Black & Scholes data formula to recreate "on
the fly" historical options data as needed by the user. This way a
trader using our software can recall acutely accurate "simulated"
options data from 30 years ago without actually having hundreds of
megabytes of options data history stored on their computer. The trader
can then simulate trading the financial options market with unparalleled
accuracy. This unparalleled capability allows new traders the ability to
learn and practice basic trading strategies that can then be taken to
the actual markets. It also allows experienced traders the ability to
create and back test advanced simulated trading models and systems.
Another way in
which Gecko Software computer scientists have implemented the Black &
Scholes formulas to help our traders is with two very unique indicators
which sit below a chart of the underlying financial asset. As the Black
and Scholes formula dictates what the actual "theoretical" value of an
option should be on any given day, Track ‘n Trade 5.0 will plot the
"actual" value of the option along side the Black & Scholes model. This
creates an overvalued or undervalued indicator, which lets our users
know, from a simple graphical representation, if the current price of an
option is inline with market sentiment and trading at a premium or a
discount.
Options data is
often times very spotty and full of holes, and due to the enormous
amount of data generated by the options exchanges, there is very little
done to try and repair these holes or bad data ticks. When options
trade, they begin a data stream where they generate an Open, High, Low
and Close for each day’s trading range, but some options, which are
usually further out of the money, don’t trade every single day. This
causes gaps or holes in the data stream. One way or another, these gaps
or holes are either filled, or just left blank. Often times, these gaps
are filled by data vendors who simply pull yesterdays values forward to
today. They’ll do this for weeks on end, which only serves to create a
very inaccurate and unreliable value stream, a stream of data that would
be difficult to use in any kind of simulated trading environment or to
provide much real-market value.
Just like the
genetic scientists did in the classic movie Jurassic Park by filling the
gaps in the dinosaurs DNA strand with frog DNA allowing them to recreate
or clone a dinosaur, our computer scientists here at Gecko Software fill
the gaps in the live options market data stream with Black & Scholes
"theoretical" prices, giving a more accurate representation of the
actual options value. This allows our users the ability to have a more
complete and highly accurate representation of what actual market data
would have been on any given day.
To differentiate
the fictitious theoretical data within the data stream, we tag it with
an asterisk (*) so our users will know when they are looking at actual
market data reported by the exchange, or a theoretical value inserted
into a gap by the Black & Scholes model. In keeping with the Jurassic
Park theme, the process that creates and inserts the theoretical data
into the actual data stream is code named "Frog Data."
Back To Top
|